We use essential cookies to make Venngage work. By clicking “Accept All Cookies”, you agree to the storing of cookies on your device to enhance site navigation, analyze site usage, and assist in our marketing efforts.

Manage Cookies

Cookies and similar technologies collect certain information about how you’re using our website. Some of them are essential, and without them you wouldn’t be able to use Venngage. But others are optional, and you get to choose whether we use them or not.

Strictly Necessary Cookies

Always Active

These cookies are always on, as they’re essential for making Venngage work, and making it safe. Without these cookies, services you’ve asked for can’t be provided.

Show cookie providers

  • Venngage
  • Amazon
  • Google Login
  • Intercom

Functionality Cookies

These cookies help us provide enhanced functionality and personalisation, and remember your settings. They may be set by us or by third party providers.

Show cookie providers

  • Venngage
  • Chameleon
  • Intercom
  • Algolia

Performance Cookies

These cookies help us analyze how many people are using Venngage, where they come from and how they're using it. If you opt out of these cookies, we can’t get feedback to make Venngage better for you and all our users.

Show cookie providers

  • Venngage
  • Mixpanel
  • Intercom
  • Google Analytics
  • Hotjar

Targeting Cookies

These cookies are set by our advertising partners to track your activity and show you relevant Venngage ads on other sites as you browse the internet.

Show cookie providers

  • Google Ads
  • Google Tag Manager
  • Facebook
  • Pinterest
  • Product
  • Templates
  • Learn
  • Pricing
Learn
Educational Resources
Blog
Webinars
Help Center

Free Supply and Demand Graph Maker

Make the right economic decisions with Venngage's free supply and demand graph maker. Visualize data and better understand how changes could affect your products and services.

Free Supply and Demand Graph Maker

Use Venngage Supply and Demand Graph Maker and our professional economic graph templates to make better decisions and increase profits. 40,000+ businesses already use Venngage!

Trusted by

Design from one of our supply and demand templates

Customize one of our professionally-designed templates. See all supply and demand graph templates

See all templates

Create a supply and demand chart in minutes with Venngage's supply and demand graph creator:

Create a supply and demand chart in minutes with Venngage's supply and demand graph creator:

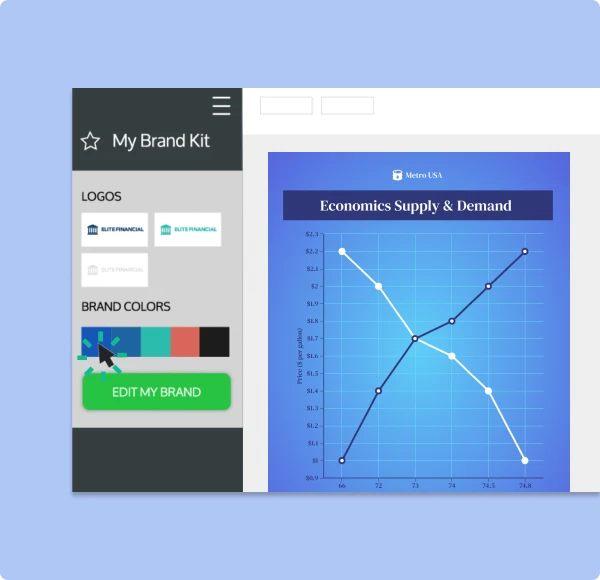
Venngage's supply and demand graph creator makes raw data easy to understand. Visualize data, track pricing changes, and monitor sales performance to make the right pricing decisions.

Create a supply and demand chart in minutes with Venngage's supply and demand graph creator:

Choose a template and start creating supply and demand curves with Venngage's smart line chart editor. Free supply and demand templates available. No design skills required.

Create a supply and demand chart in minutes with Venngage's supply and demand graph creator:

Visualize the supply curve, demand curve and find the market equilibrium in several clicks. Add your data points directly or upload your data spreadsheet document in one click.

Create a supply and demand chart in minutes with Venngage's supply and demand graph creator:

Liven up your supply and demand diagram by changing the colors of the line graphs or by adding design elements like icons and illustrations.

How do you make a supply and demand graph?

1
Sign up for a FREE Venngage account with your email, Facebook or Gmail address.
2
Pick a supply and demand template from our professionally designed templates.
3
Add your data. Quantity data is on the y axis (horizontal line) and pricing data is on the x axis (vertical line).
4
Start customizing your graph in our smart editor. Add images, icons, and branding with a single click.
5
Share your economic graph with a free link or upgrade to download.
How do you make a supply and demand graph?

Use Venngage's supply demand graph maker for better understanding and effective decision-making:

Supply and Demand Graph Templates

Supply and Demand Graph Templates

Get a clear picture of the market. Make better business decisions with Venngage's easy-to-use supply and demand graph templates.

Smart Economics Graph Editor

Smart Economics Graph Editor

Present complex data in an easy-to-understand way using Venngage's economic graph maker. Add or remove text, lines, and branches with a single click.

Download in Multiple Formats

Download in Multiple Formats

Easily share your graph with a private link or upgrade to download. Download options include PNG, PDF, PPTX (if you want to use your graph in a presentation) or HTML (if you want to import it into your emails).

24-Hour Priority Support

24-Hour Priority Support

Got a question? We're here to help. The support team is available 24/7, so your team can keep working like clockwork.

Icons and Illustrations

Icons and Illustrations

Your supply and demand diagram doesn't need to look boring. Venngage offers 40,000+ icons and illustrations to bring your graphs to life.

Team Collaboration

Team Collaboration

Collaborate in real time with your team when using Venngage's supply and demand graph creator. Create, share comments and get feedback.

CREATE SUPPLY AND DEMAND GRAPHS
Create supply and demand graphs with the perfect tool in minutes

Create supply and demand graphs with the perfect tool in minutes

  • Start by choosing a template that suits your needs. Easily create effective supply and demand graphs from raw data with a few clicks. Free templates available.

  • Import data easily. You can manually insert your data into the chart editor or import it from your file (Google Sheets or Excel) directly.

  • Make sure your quantity data stays on the y axis (horizontal line) and pricing data on the x axis (vertical line). Connecting the data points and you'll have your demand curve and supply curve. The intersection of the two is your equilibrium point.
  • Add design elements to your economic graph to make it stand out

  • You can either create a supply and demand diagram from scratch, or you can choose from our easy-to-edit templates.

  • Quickly edit lines, shapes, text and colors to get a clear picture of the market and find effective solutions. You can choose different styles for your line graph as well.

  • Easily customize your template by adding icons and illustrations. Venngage offers 40,000+ icons and 3+ million stock photos.
  • Add design elements to your economic graph to make it stand out
    Collaborate with your team from anywhere, at anytime

    Collaborate with your team from anywhere, at anytime

  • Collaborate in real-time when you're creating a supply and demand graph. Share ideas and insights with your teams within Venngage's editor.

  • Get instant feedback and add comments with team members so your content is always correct. Invite team members, share templates, add folders and more.

  • Start collaborating by simply clicking "Share" from the editor. Copy a private link and share it with team members. Add team members to your Venngage account so that they can make edits.
  • Branded graphs with just a few clicks

  • Internal documents also need to contain consistently branded designs to be memorable. My Brand Kit lets you save and apply your branded asses to every graph with one click.

  • You can also apply your brand colors and fonts across designs. Simply add your website when prompted and our editor will import your branding to add to the supply and demand charts.
  • Branded graphs with just a few clicks

    FAQs about Supply Demand Graphs

    What is a supply and demand graph?

    A supply and demand graph visually presents the relationship between price and quantity demanded in your market so you can have insights to make accurate, timely pricing decisions. The graph can help policymakers and analysts understand when prices are likely to rise or fall, and how changes in supply or demand might affect prices. For example, if the demand for a product increases, then the demand curve will shift to the right, and the equilibrium quantity and price will increase. If the supply of a product decreases, then the supply curve will shift to the left, and the equilibrium quantity and price will decrease.

    Can I edit my graph after downloading or sharing it?

    You can edit your supply and demand graph whenever you want. Venngage's smart editor automatically saves your work progress. That means you can always log in to our supply and demand chart maker, see previous versions of your design and keep editing it.

    How do you create a supply and demand graph?

    You can create a supply and demand chart by using Venngage's economics graph maker. Simply choose from our easy-to-edit templates, add your data or upload it from your files, and customize your graph as you like. Free supply and demand templates available.

    Try Venngage's free supply and demand graph maker today and make better decisions for your organization.

    CREATE SUPPLY AND DEMAND GRAPHS

    Get started with one of our top supply and demand graph templates:

    CREATE SUPPLY AND DEMAND GRAPHS