


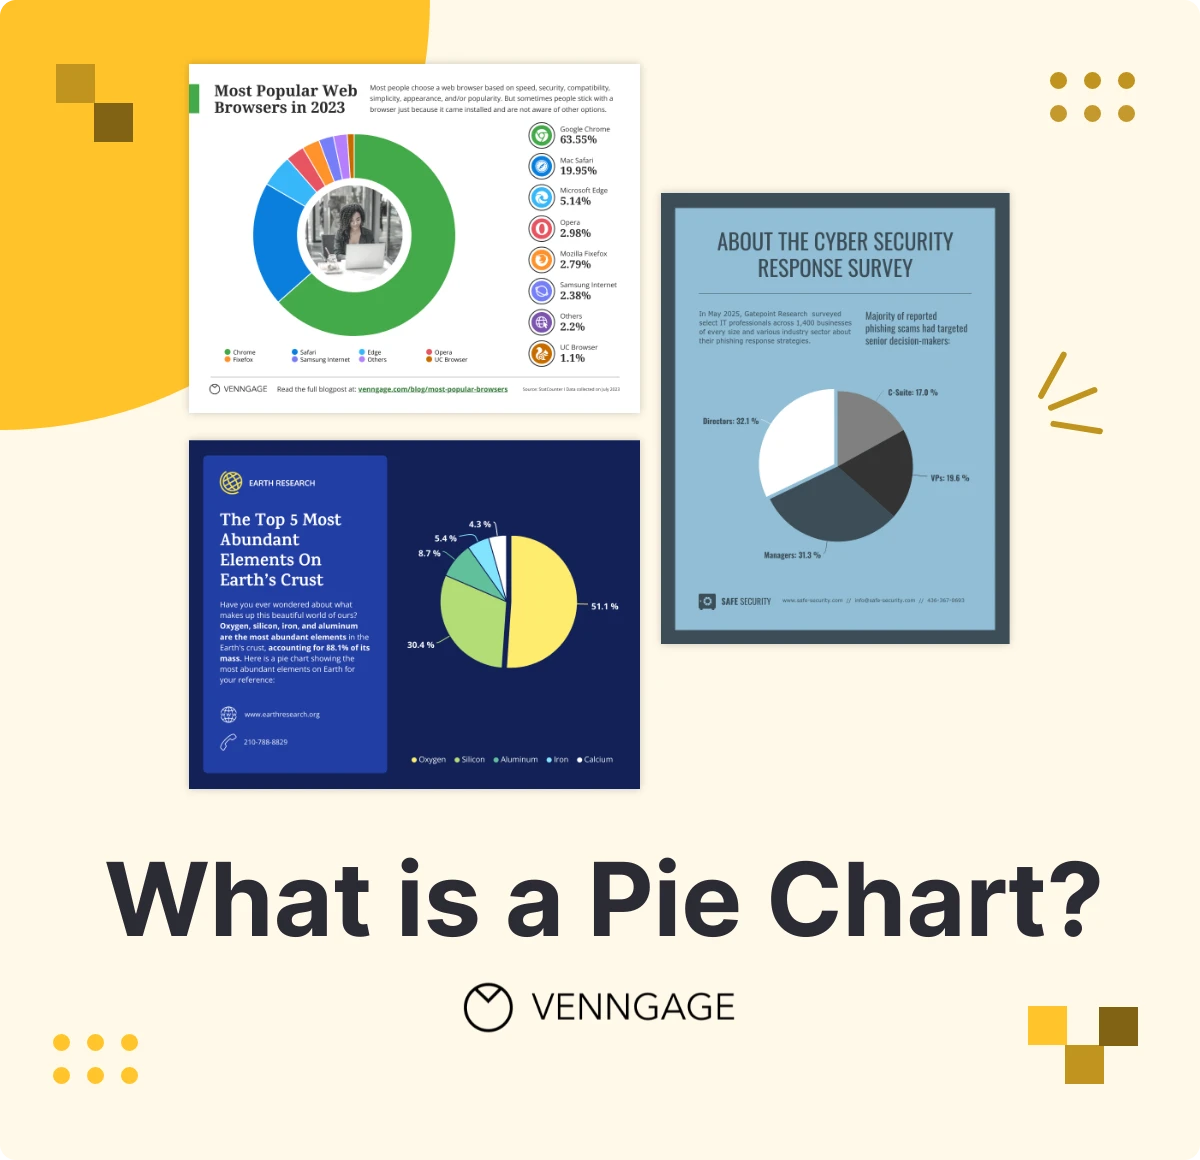
Free Online Pie Chart Maker
Make beautiful pie charts and donut charts in minutes with Venngage's easy-to-use templates and free pie chart maker, so your reports and presentations make an impact.


Visualize your complex data with Venngage's free pie chart maker online — no design skills required. Join over 40,000 businesses that use Venngage to make a pie chart.
Trusted by
Design from one of our pie chart templates
Customize one of our professionally-designed templates. Sell all pie chart templates


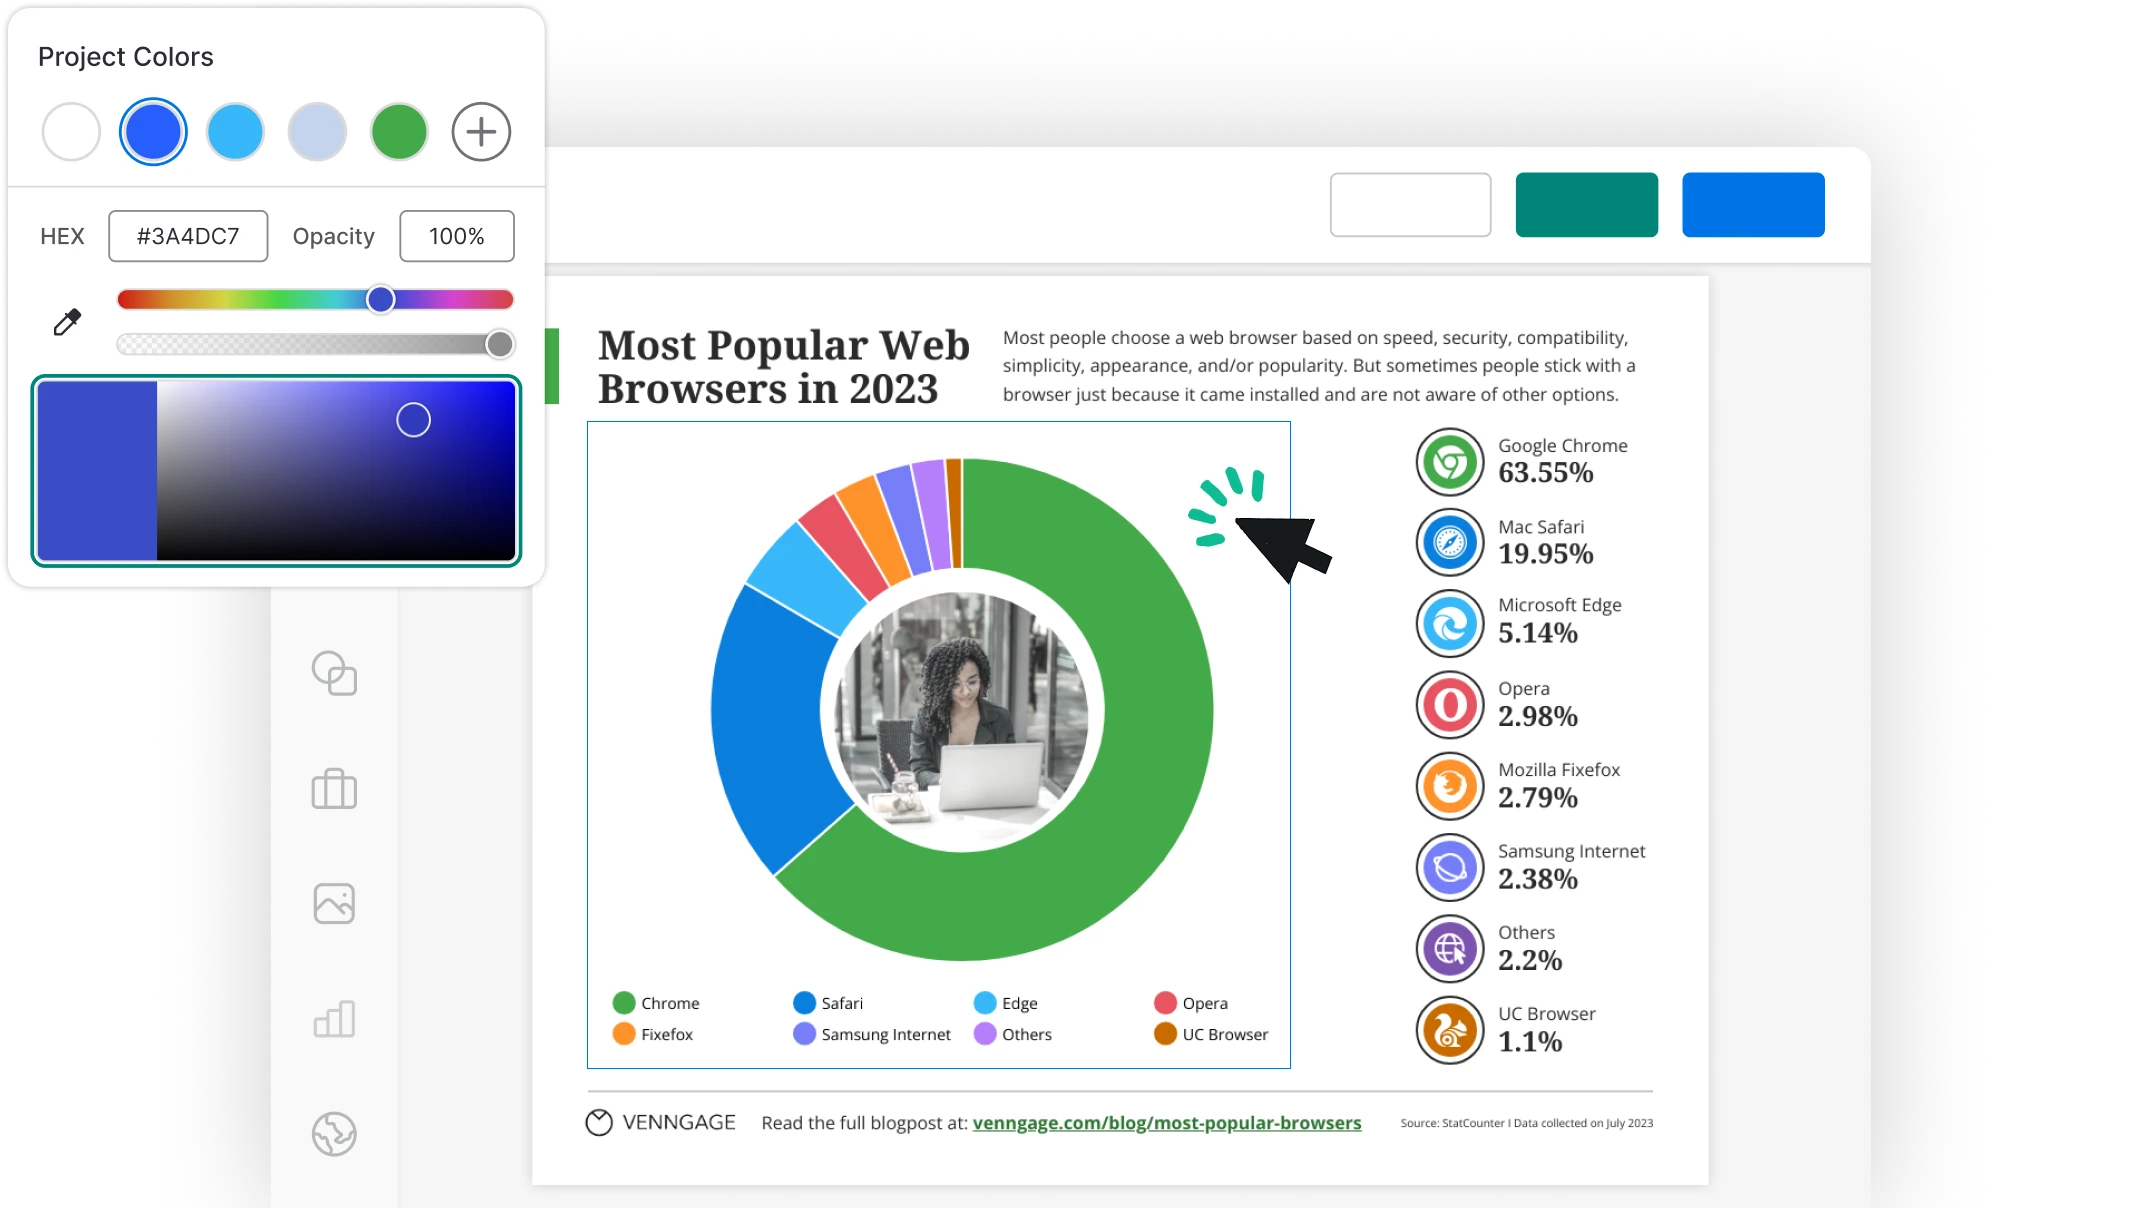
Build a perfect visual for your data with the online pie chart maker


Want to show your key business metrics or identify what products are selling at a glance? Instead of showing random series of numbers and categories, turn your data into a pie chart that delivers important information and adds value to your report or presentation.

You can easily create your own pie chart and share it online or add it to your business documents by using Venngage's pie chart generator. We also offer pie chart infographics, donut chart infographics — the list goes on.

Pick a pie chart template and upload your data values from your spreadsheets or directly customize the numbers in our data table with your values and categories. Or flip between pie chart styles with one click.

Tell powerful data stories and keep your stakeholders engaged — create custom pie charts or doughnut charts easily using Venngage's online pie chart maker.
How to build a custom pie chart in five easy steps:

Create custom pie charts easily using Venngage's free pie chart generator


Pie Chart Templates
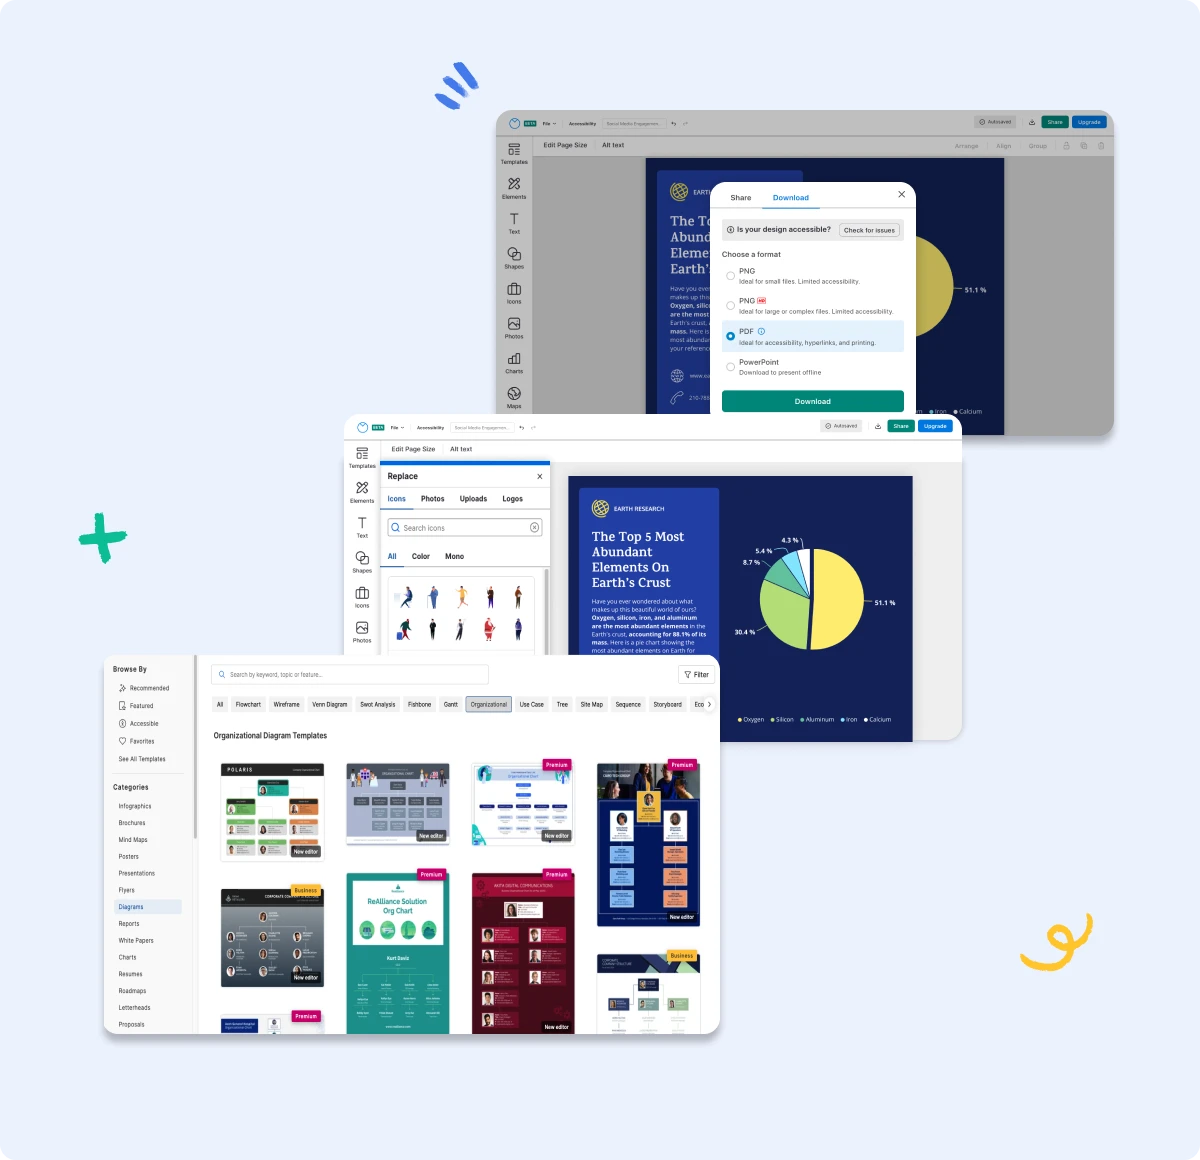
Need to visualize parts of a whole? Among all chart types, pie charts and donut charts are the perfect types to represent percentages. Choose from tons of professional pie chart and doughnut chart templates you can edit right away.

User-Friendly Editor
Venngage's pie chart editor is simple to use. You can upload your data with one click, choose from different pie chart styles and drag and drop different design elements to make your pie charts more visually engaging.

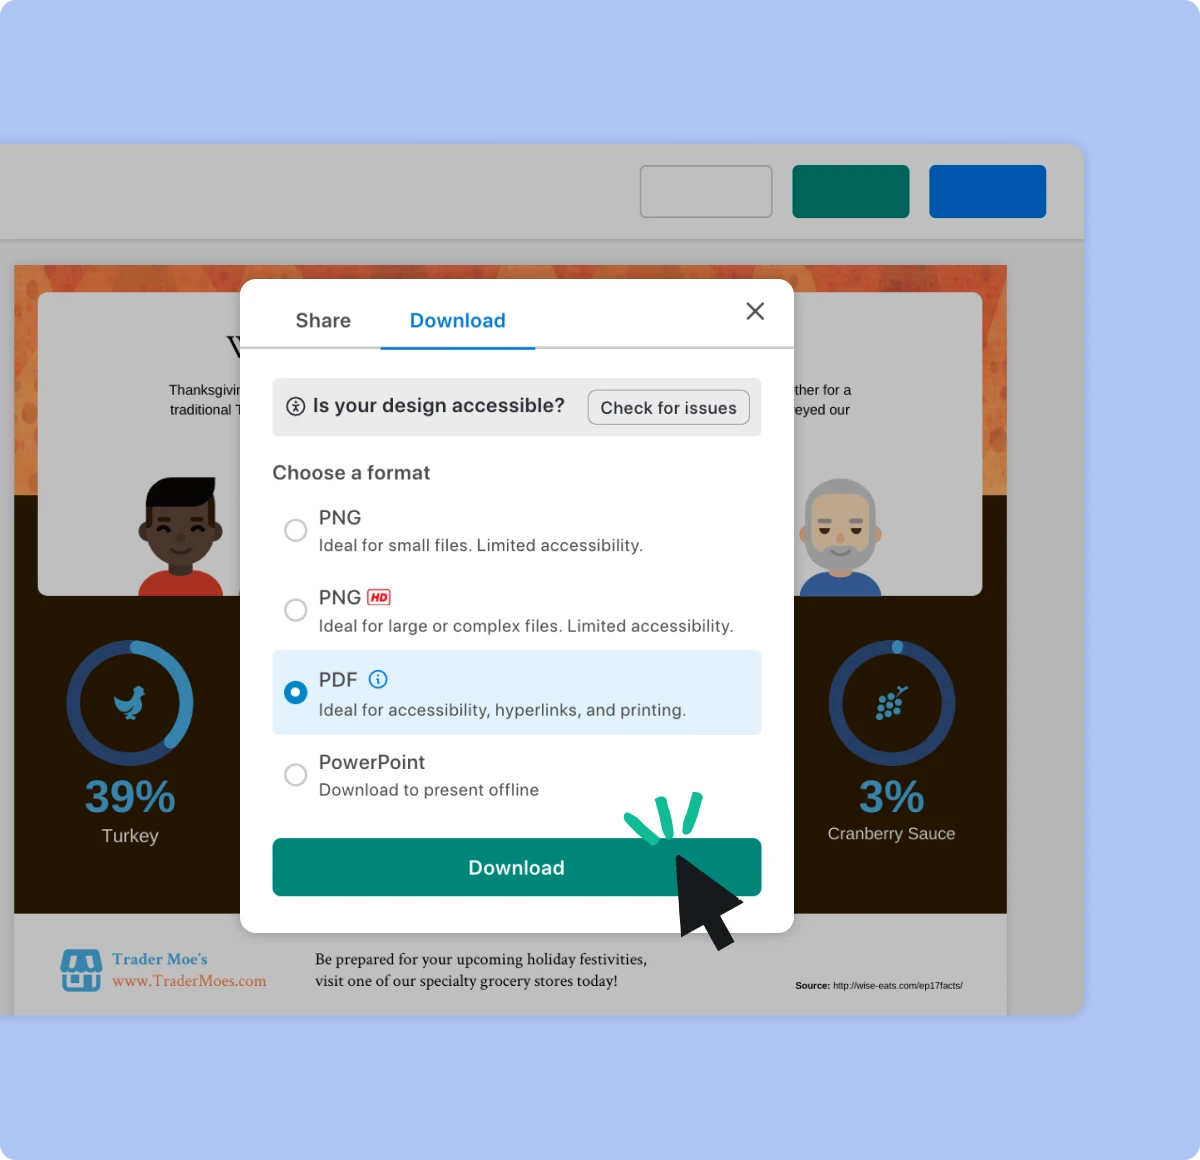
Export to PNG, PDF, or PowerPoint
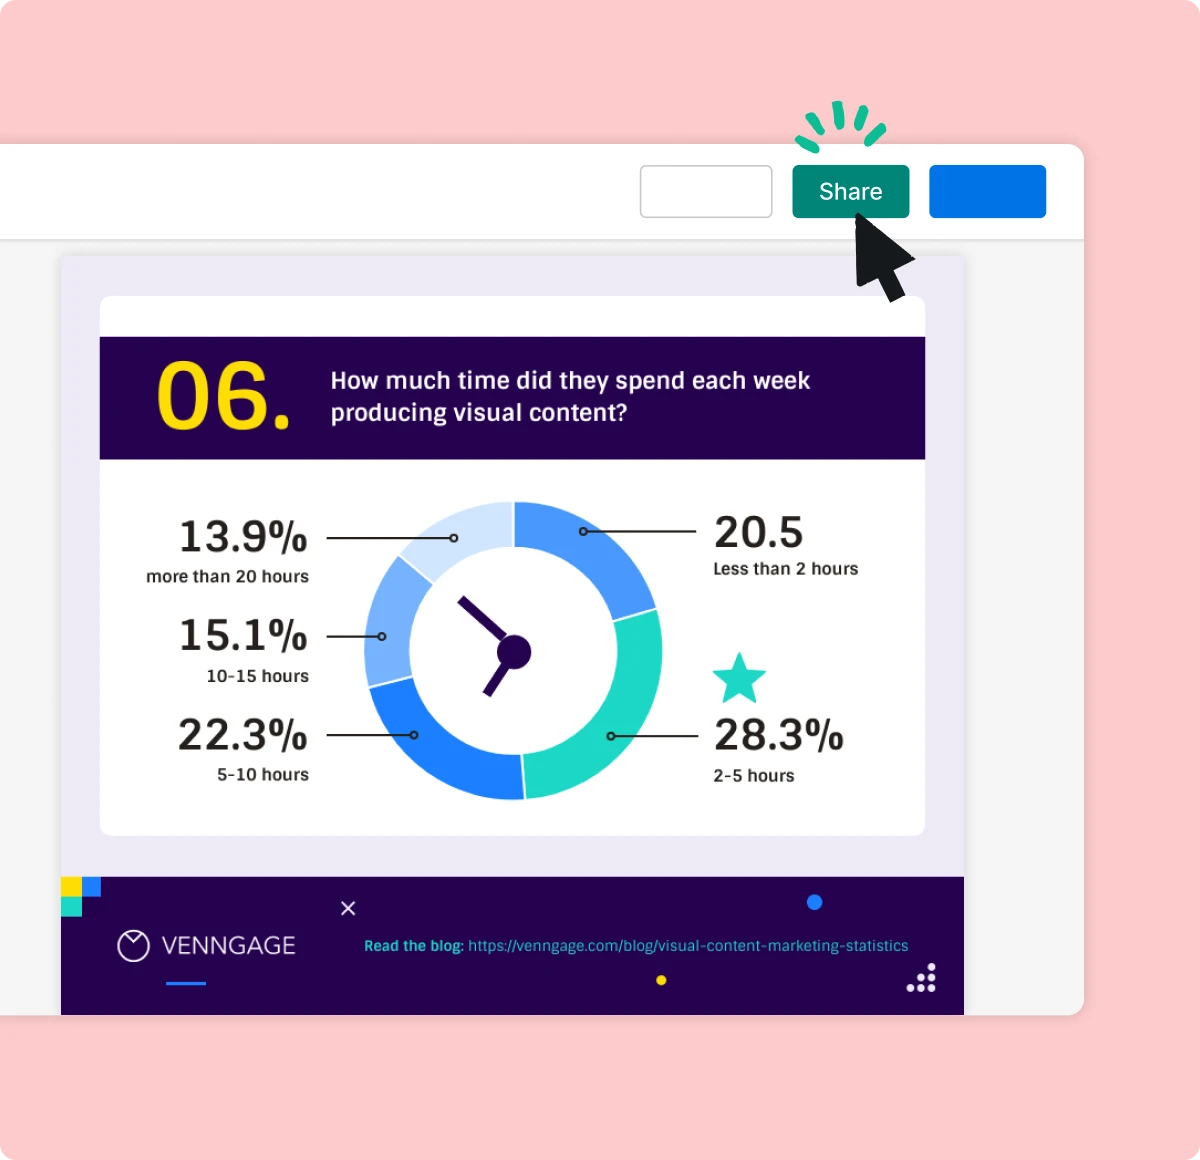
Export or download your pie chart as an image file (PNG), PDF or PowerPoint slide with a Venngage business account. Or easily share your pie chart online completely for free.

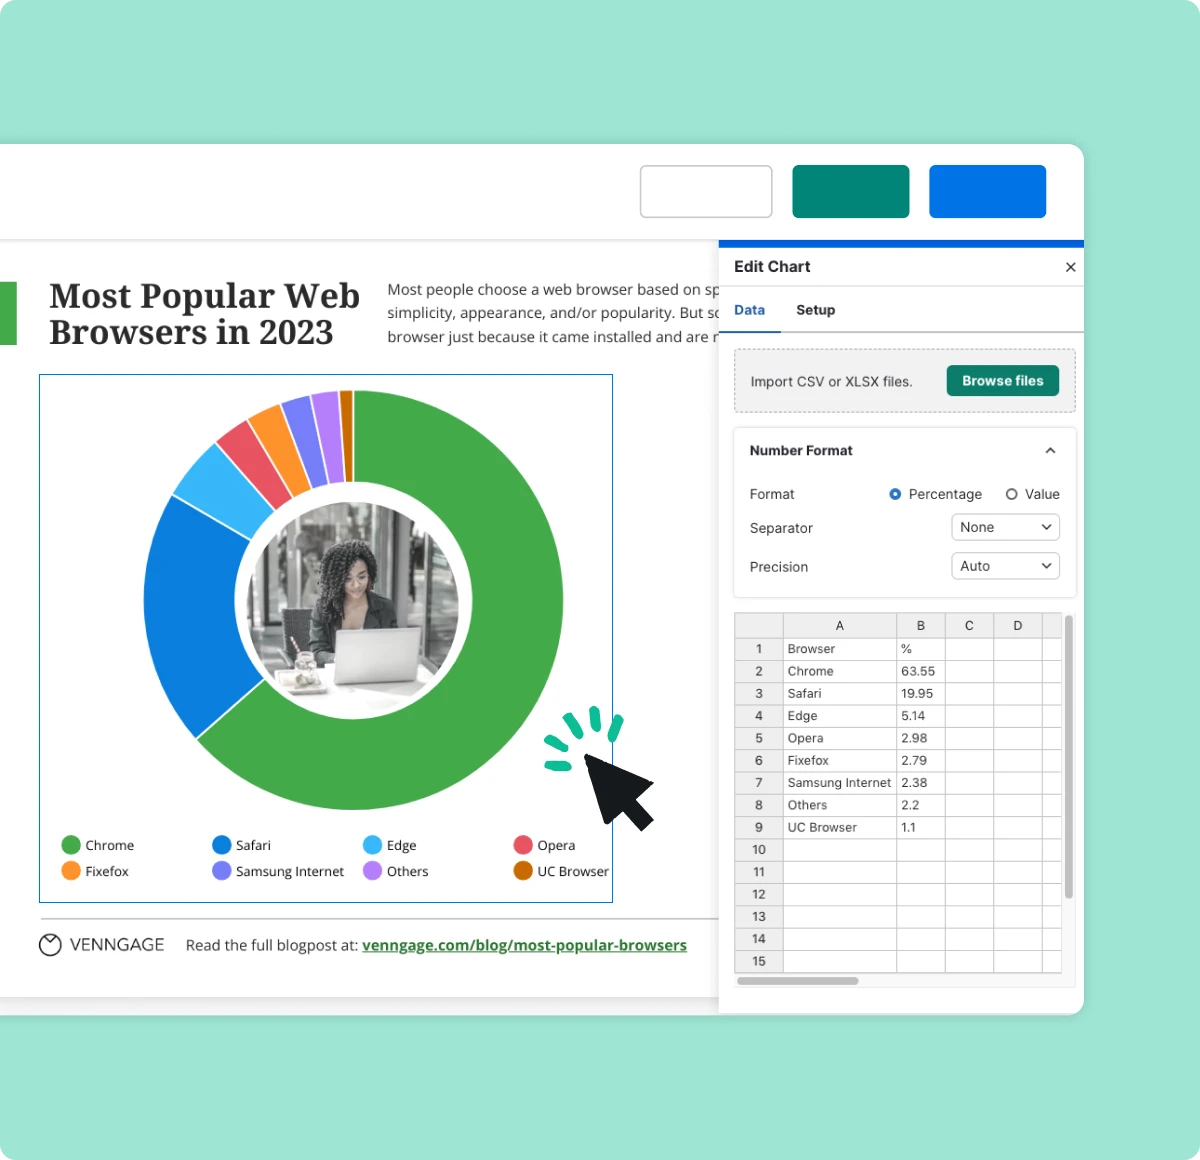
Easy Data Import
Enter your data into our simple Pie Chart Maker or upload directly from an XLSX or CSV file. Add or remove chart title, data labels, and data points easily. Change the x- and y-axes as needed. Keep your pie chart simple by using only data that tells an important story.

Brand Identity
Apply brand colors and logos to your pie chart with one click with Venngage's My Brand Kit. Have your brand elements automatically uploaded to your account by typing in your website address.

Real-Time Team Collaboration
Get your team involved to create custom pie charts that are impactful. Use the Team Sharing option to work collaboratively with team members in real time.
Venngage Pie Chart FAQs:
Where can I create a pie chart for free?
You can make a pie chart online for free by using Venngage's easy pie chart maker. Pick a pie chart template or — if you're looking to create an infographic, report or presentation that contains pie graphs, look within those categories. Start editing using the drag-and-drop editor. You can also add chart titles, data labels and beautiful design flairs to your design easily.
Can I edit my graph after it's saved?
Absolutely. The Venngage editor automatically saves your work as you go along. Exit the editor and come back at any time to make changes.
Can I share or print out my graph?
You can share your pie graph for free with a public link. For multiple download options (PNG, PDF, PowerPoint or HTML), upgrade to a paid plan. Venngage Business users can also access paid templates, premium design assets and other business perks like My Brand Kit and Real-Time Collaboration.
See a template you like? Sign up with Venngage and select any of our memorable templates to start designing.
CREATE PIE CHARTS


