Visual Content Format Performance Chart Template
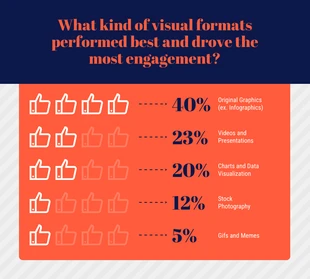
For a dramatic eye-catching chart, modify this Icon Chart Template within minutes!
100% customizable templates
Millions of photos, icons, charts and graphics
AI-powered editing features
Effortlessly share, download, embed and publish
Easily generate QR codes for your designs
- Design stylemodern
- Colorsvibrant
- SizeCustom (816 x 735 px)
- File typePNG, PDF, PowerPoint
- Planpremium
Reinvent your data charts with this customizable Icon Chart Template. Take advantage of our icon charts for a simple but effective way to visualize your data. We have thousands of icons you can choose from to create your icon charts. Choose your icon charts from the icon charts tab in the editor, then select the number of rows and columns you’d like, along with the percentage you want to represent. Easily apply a color palette that you want in just a click with My Brand Kit. You can choose your brand colors and logos, or completely different color palettes from preset swatches. You can also check out our gradient backgrounds and background designs. Just like that, your chart is ready to get shared on social media or included in a blog post, white paper, and ebook. We have templates for everything you need - check out Venngage for compelling chart templates and more!
