Visual Content Pie Chart Template
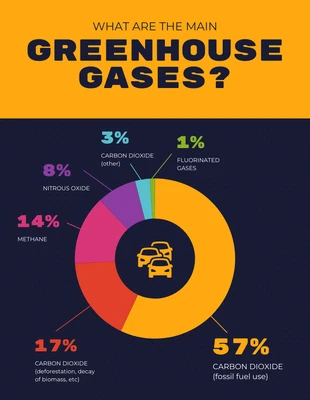
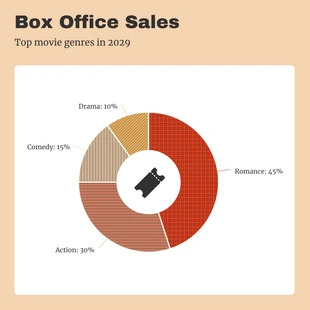
Edit this Visual Content Pie Chart Template to display the top marketing visuals!
100% customizable templates
Millions of photos, icons, charts and graphics
AI-powered editing features
Effortlessly share, download, embed and publish
Easily generate QR codes for your designs
- Design stylemodern
- Colorsdark, vibrant
- SizeCustom (816 x 909 px)
- File typePNG, PDF, PowerPoint
- Planpremium
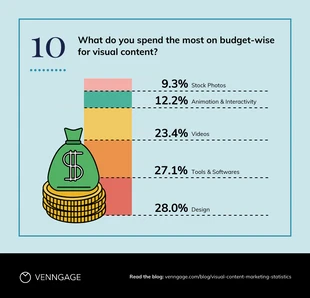
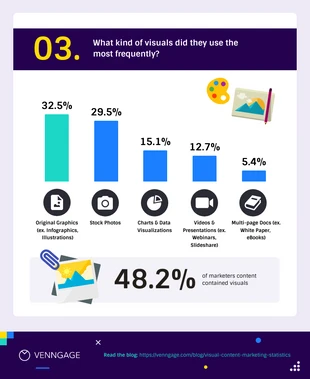
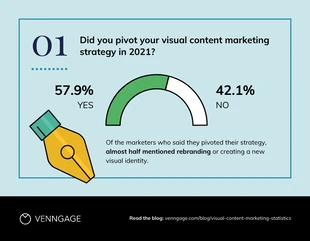
Make your data jump out with this easily editable Visual Content Pie Chart Template. You can showcase anything from marketing trends to survey results and more! All our charts and graphs can be customized in a flash. Just double-click to open their menu, and import your spreadsheet directly. You’ll watch the chart transform. In the same menu, you can edit the colors, labels, design styles and other elements for a totally customized look. Be sure to check out Venngage’s icons library, with thousands of unique icons to choose from. You can pair with them each data point to help emphasize each point. Add to your creative style by using eye-catching font styles for a unique look. Then add a customized color palette with a click from My Brand Kit, or choose from a variety of gradients and background designs for something engaging. In just a few minutes you’ll have a great chart design ready to be share online, or in print in your upcoming blog post, ebook, white paper and more! For more easy-to-edit chart templates like this one, check
Explore more
- Survey
