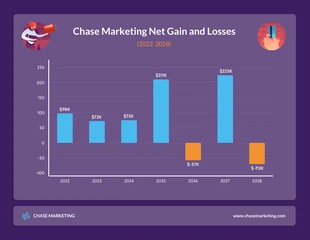
Marketing Gain and Loss Bar Diagram Chart Template
Visually design a bar diagram using Venngage bar diagram template.
100% customizable templates
Millions of photos, icons, charts and graphics
AI-powered editing features
Effortlessly share, download, embed and publish
Easily generate QR codes for your designs
- Design stylemodern
- Colorsdark
- SizeLetter (11 x 8.5 in)
- File typePNG, PDF, PowerPoint
- Planpremium
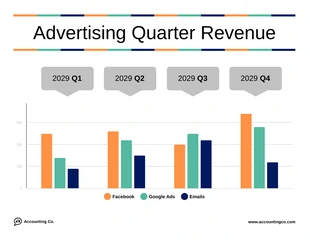
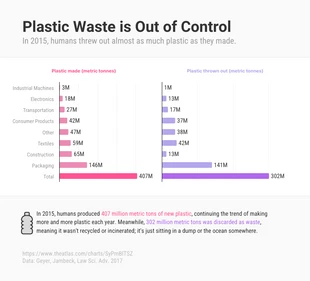
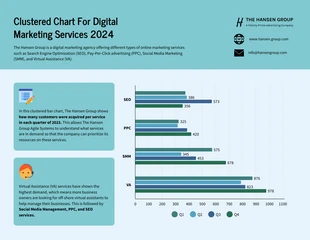
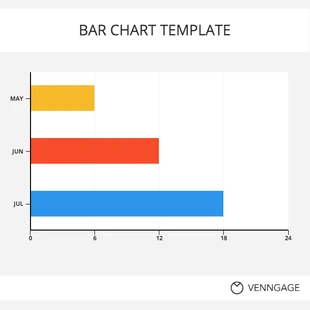
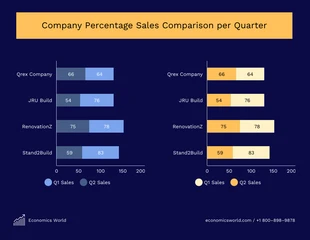
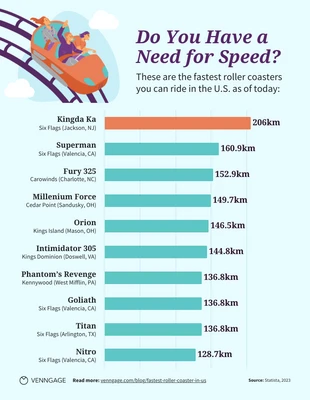
A bar diagram template is a tool that can be used to display data in a bar graph format. The bars can be used to compare different data points, or to compare data over time. This bar diagram template is suitable for both personal and business purposes. The bar graph represents data using bars of different heights and widths. Bars that are taller indicate a greater quantity and the bar graph is used to compare those quantities. The bar graph can be used for anything from analyzing sales to sports statistics, to bar chart examples. Use Venngage's bar diagram template design to create a bar graph visually. You don't need any previous design knowledge or utilize any design software to modify this bar diagram template. To design this bar diagram template, start by clicking ""Create.""You may personalize everything you see in the editor, from font types, icon designs, color palettes, and content. To begin, add your material. You can use the template's stock font or alter it in the editor's top panel if you like. Dozens of chart types are available, including pie
