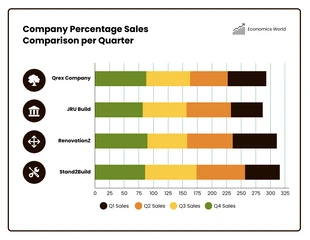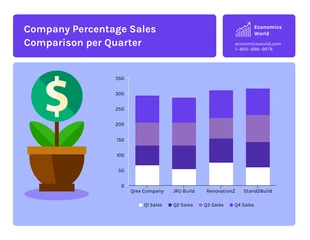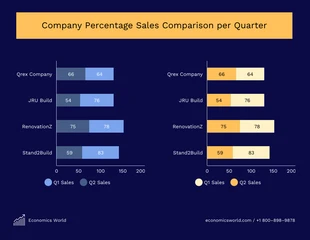
Company Sales Comparision Stacked Bar Chart Template
Create & share your bar chart stacked in minutes with Venngage. Transform your numbers into an attractive infographic template today!
100% customizable templates
Millions of photos, icons, charts and graphics
AI-powered editing features
Effortlessly share, download, embed and publish
Easily generate QR codes for your designs
- SizeLetter (11 x 8.5 in)
- File typePNG, PDF, PowerPoint
- Planfree
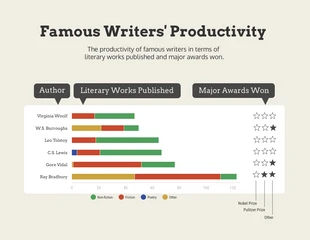
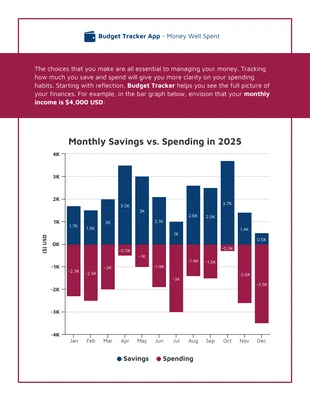
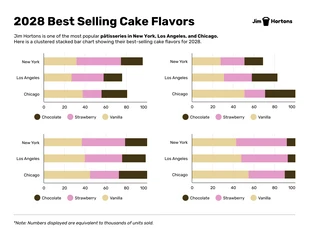
A bar chart stacked is a type of bar chart where each bar is split into segments that are based on a single data value. Bar chart stacked are useful for showing how different groups or categories compare to each other, and they're often used to show comparisons between a few different groups or items. Bar chart stacked are beneficial because they help users understand the relationships between the different parts of your data set, which can help them make more informed decisions about their choices and purchases. Anyone who has access to the data needed for creating this type of graph should be able to use it effectively! If you’re looking to make a bar chart that displays data in multiple segments stacked on top of each other, this template from Venngage can help get you started. Even if you don’t have any design or layout experience, the drag-and-drop editor makes it easy for anyone to modify elements like labels and colors and add or remove data points. This bar chart stacked template is a great
