Marketing Stats Stacked Bar Chart Template
Design a professional-looking bar chart for your business marketing stats. Customize this Stacked Bar Chart Marketing Stats Template to get started.
100% customizable templates
Millions of photos, icons, charts and graphics
AI-powered editing features
Effortlessly share, download, embed and publish
Easily generate QR codes for your designs
- Design stylemodern, fun
- Colorslight
- SizeCustom (816 x 730 px)
- File typePNG, PDF, PowerPoint
- Planfree
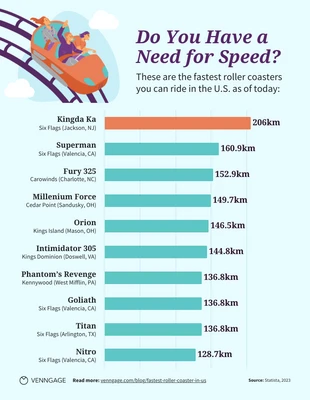
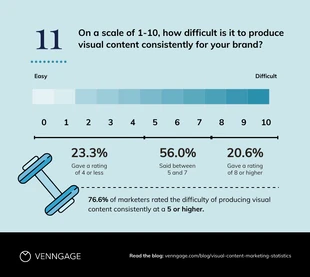
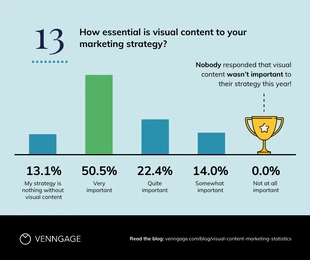
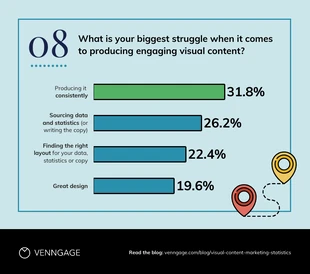
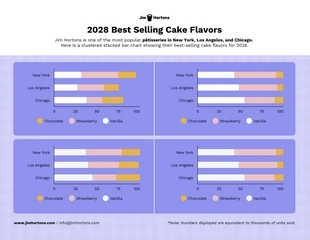
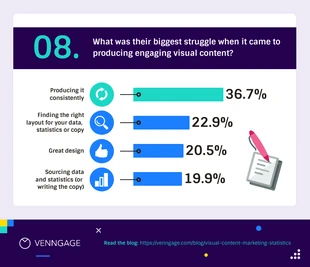
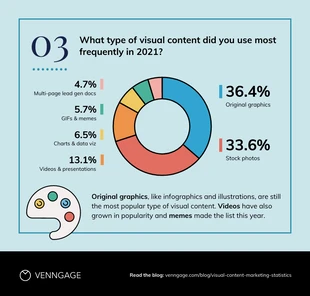
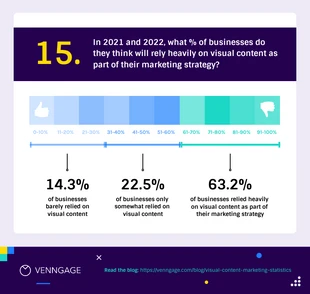
A stacked bar chart marketing stats template is a visual representation of data that allows you to compare different categories of information. The bars are arranged in order from largest to smallest and the height of each bar represents the value. The bars can be divided into groups or categories, with each group represented by a different color. This allows you to clearly see trends in data over time. This kind of template is especially useful if you want to compare different marketing tactics or analyze how effective your campaigns were this year compared to last year. Stacked Bar Chart Marketing Stats Templates give users an easy way to see how one value compares with another by displaying both on the same chart. These templates can also be used for marketing purposes, as well as for other areas such as science, sports, and general finance. Our stacked bar chart marketing stats template is a great way to show off your company's accomplishments in an eye-catching, colorful format. It's easy to use: just change the colors or text and you're done! At Venngage,
