PowerPoint Gantt Chart Presentation Template
Make professionally made powerpoint gantt chart by editing our powerpoint gantt chart template.
100% customizable templates
Millions of photos, icons, charts and graphics
AI-powered editing features
Effortlessly share, download, embed and publish
Easily generate QR codes for your designs
- Design stylemodern
- Colorslight
- SizeCustom (1280 x 720 px)
- File typePNG, PDF, PowerPoint
- Planpremium
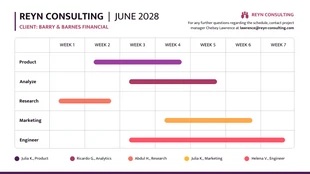
Gantt charts use bars to illustrate the relationship between two measures, time and work. Gantt chart bars are drawn as either vertical or horizontal, with the length of the bar corresponding to duration and a label attached to its end indicating progress. With a chart template, you can easily visualize how your tasks relate to the overall project and to one another. This allows you to devise a strategy that can keep your projects on track, and it provides you with an easy way to communicate this information with other team members. Create a PowerPoint Gantt chart using Venngage’s chart template. Making a PowerPoint chart only requires the use of a computer and your basic understanding of word processing. In fact, you don't need any design skills at all to create a custom-branded chart. Powerpoint Gantt charts can be customized by adding logos or images from online sources or from your own imaging files. You can even insert images and graphics from other Microsoft Office programs such as Word or PowerPoint. Venngage’s library of unique, handcrafted icons is fun to use and


