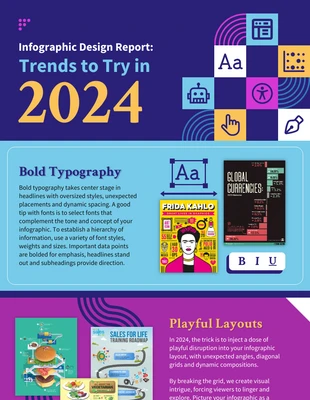
Visual Content Marketing Stats Infographic Template
Design a professional infographic to spread awareness about your content. Start by editing this Visual Content Marketing Stats Infographic Template.""
100% customizable templates
Millions of photos, icons, charts and graphics
AI-powered editing features
Effortlessly share, download, embed and publish
Easily generate QR codes for your designs
- Design stylemodern, fun
- Colorslight
- SizeCustom (816 x 4900 px)
- File typePNG, PDF, PowerPoint
- Planfree
If you need to communicate important information about your marketing stats, you need to make your content visually appealing. Sometimes, to engage your audience and keep their attention, you must avoid using complex words and complicated numbers. This is where using an infographic becomes an advantage. And if you are not skilled enough to create your very own infographic from scratch, don’t fret. This visual content marketing stats infographic template from Venngage can help you get started on the right direction. An infographic is an important element of visual communication. In today’s digital world where images and visuals play a big role in marketing, access to a visually-engaging medium gives you an advantage over your competitors. Through infographics, you can present information, data, and statistics in a visual manner. This helps make complex ideas easier to understand for your audience, improving recall and engagement for your content. This visual content marketing stats infographic template is a tool that you can use to explain important marketing stats about your organization, company, or business. Using tools such as images, icons, and charts, this infographic
