Vibrant Infographic Template
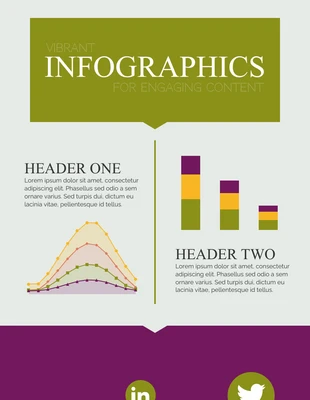
Need engaging infographics? Customize this Vibrant Statistical Infographic Template for a captivating design!
100% customizable templates
Millions of photos, icons, charts and graphics
AI-powered editing features
Effortlessly share, download, embed and publish
Easily generate QR codes for your designs
- Design stylemodern
- Colorsvibrant
- SizeCustom (816 x 2000 px)
- File typePNG, PDF, PowerPoint
- Planfree
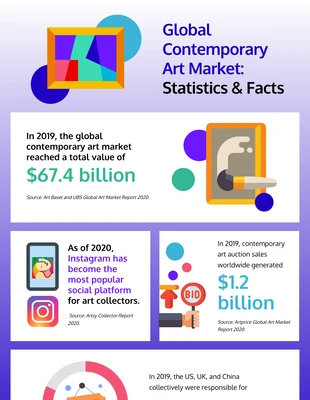
Create a colorful statistical infographic and more with this customizable Vibrant Statistical Infographic Template. Add your own personal touch by applying a dramatic color scheme, charts, and large headings. Dramatic colors will make the statistical infographic more visually appealing and will maintain the reader's focus. Venngage has hundreds of automated color palettes, including dramatic color schemes, or you can customize your own color palette for the infographic. Clearly explain statistics and data by inserting charts into the Vibrant Statistical Infographic Template. Venngage has an array of chart options that range from bar charts to line charts, so you're covered! As for the text, make sure each section of information is clear by using large headings throughout the infographic. All you need to do is highlight the headings and click on the point size in the Venngage editor tool. Do you have questions about the Vibrant Statistical Infographic Template? Chat with us via the chat icon below and we'll be happy to help!

