Real Estate Digital Trends Infographic Template
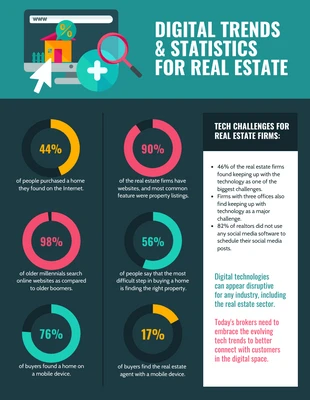
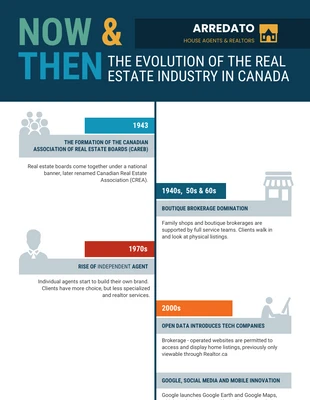
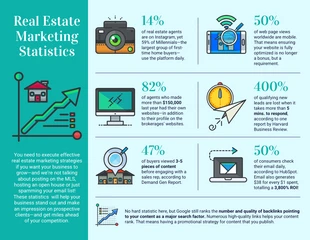
Create a vivid real estate infographic and more by editing this Statistical Real Estate Digital Trends Infographic Template
100% customizable templates
Millions of photos, icons, charts and graphics
AI-powered editing features
Effortlessly share, download, embed and publish
Easily generate QR codes for your designs
- Design stylemodern
- Colorsvibrant
- SizeLetter (8.5 x 11 in)
- File typePNG, PDF, PowerPoint
- Planpremium
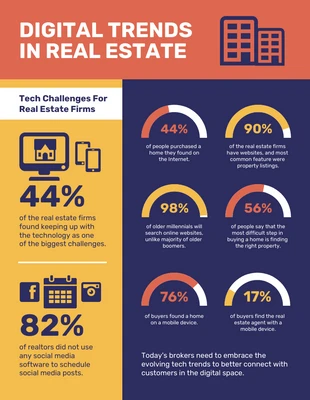
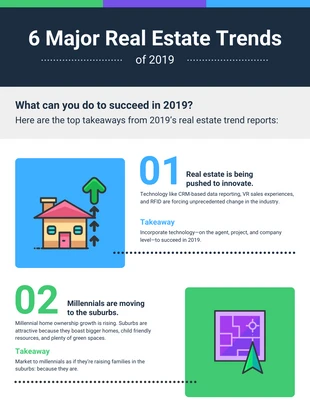
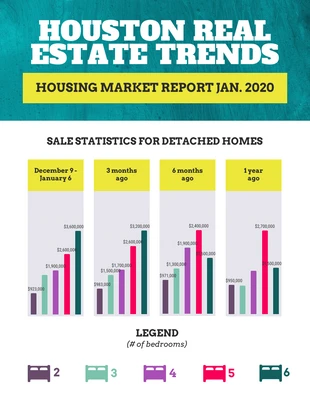
Breakdown real estate trends and more with this editable Statistical Real Estate Digital Trends Infographic Template. Make it your own by customizing the charts, icons, and dramatic color palette in addition to the content. Start out by utilizing charts to display data and other statistics. You can choose from a large selection of charts, including but not limited to semi-circle pie charts, bar charts, and scatter charts. Simply pick a chart from the gallery, insert it, and then upload a sheet or document and watch it transform right on the page. Next, add icons that will make the Statistical Real Estate Digital Trends Infographic Template more interesting to read. Venngage has thousands of eye-catching icons and images that will enhance the look and feel of your real estate infographic. Put the finishing touches on by picking a dramatic color palette that will captivate your audience. Make your own dramatic color scheme or use one of the existing dramatic color palettes on Venngage. Not quite what you wanted? Explore Venngage for more modern infographic templates!
