Portland Oregon 2021 Temperatures Infographic Template
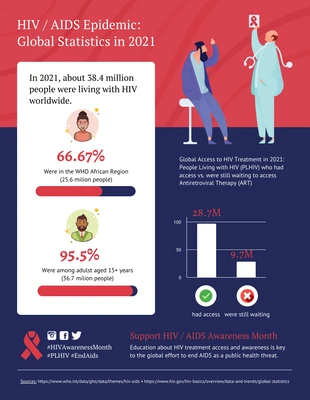
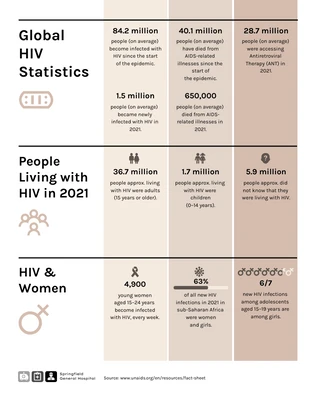
This Portland Heatwave infographic helps you understand how hot it really is in Portland, visualizing historical trends and this summer’s severe spike.
 100% customizable templates
 Millions of photos, icons, charts and graphics
 AI-powered editing features
 Effortlessly share, download, embed and publish
 Easily generate QR codes for your designs
- Design stylemodern
- Colorsvibrant
- SizeCustom (816 x 3220 px)
- File typePNG, PDF, PowerPoint
- Planpremium
The Portland Heatwave was a string of 3 days in June 2021 where temperatures reached 100°F each day! It was part of a heatwave that swept the U.S. west coast as spring turned to summer. This Portland Heatwave infographic captures historical data and trends reaching as far back as 1938, comparing Portland’s hottest temperatures in the last 83 years. This Portland Heatwave infographic design is a customizable template made for non-designers who want to create their own viral infographics. With the use of bold headings, large icons, a timeline and chart, this infographic design tells a complete story through visuals. With some changes, you can create your own professional infographic to share online. Here’s how. Click create to get started and dive into the online Venngage editor. Every infographic needs an eye-catching header, and a brief description of what it’s about. This will help provide context to anyone who may not be familiar with the topic you’re exploring. Choose bold fonts that stand out and can be read easily, even on mobile devices. As for your description, be informative but
Explore more
- Modern