Pharmacy Infographics Template
Create a high-quality infographic with no design experience. Customize and edit this pharmacy infographics from Venngage today.
100% customizable templates
Millions of photos, icons, charts and graphics
AI-powered editing features
Effortlessly share, download, embed and publish
Easily generate QR codes for your designs
- Design stylemodern
- Colorslight
- SizeCustom (1000 x 2270 px)
- File typePNG, PDF, PowerPoint
- Planpremium
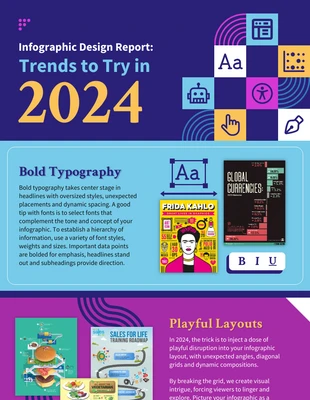
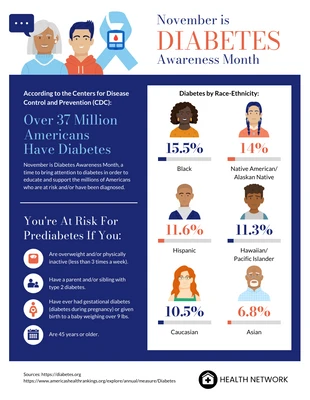
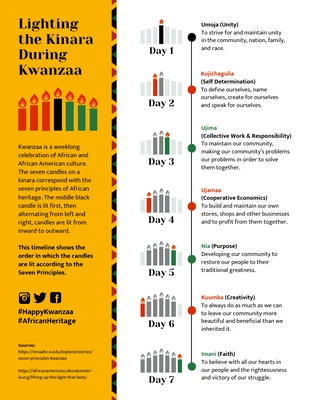
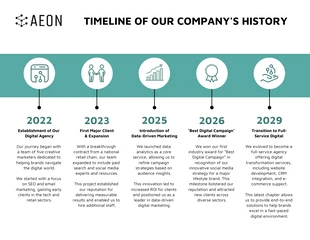
An infographic is a great way to explain complex concepts and data visually. Because images can convey words and make complicated information easier to understand, organizations use infographics to communicate effectively with their audience. These pharmacy infographics are examples of complex information explained through a visually-engaging medium. By using images and icons alongside carefully-explained information, readers can understand the message conveyed easily. Organizations and businesses often use infographics to present complex data in a format that is easy to understand. The layout of the pharmacy infographics that you see here in this template is pre-designed for users with no design experience. You can easily modify this template to suit your needs with just a few button clicks. When creating high-quality pharmacy infographics, there are a few things that you must keep in mind. The design and layout of the document must be visually appealing and easy to remember. Second, you must ensure your data is not out-of-date. Finally, you must use the right images and icons to represent your information. When creating a professional-looking, high-quality infographic, always determine the proper format and layout that

