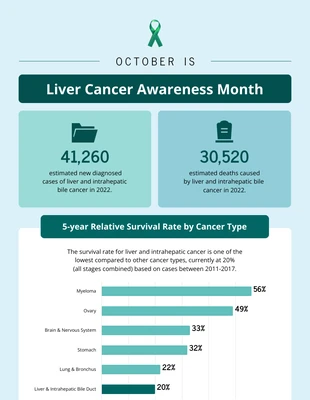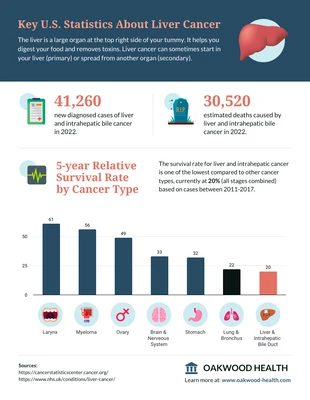
Liver Cancer Survival Rate Statistics Infographic Template
Help people make informed decisions throughLiver Cancer Statistics. Alter this template to give them a visual representation of the numbers.
100% customizable templates
Millions of photos, icons, charts and graphics
AI-powered editing features
Effortlessly share, download, embed and publish
Easily generate QR codes for your designs
- Design stylemodern
- Colorslight
- SizeLetter (8.5 x 11 in)
- File typePNG, PDF, PowerPoint
- Planfree
Presenting Liver Cancer Statistics through charts, tables, or graphs allow people to develop a clear understanding of the numbers they see on reports. This is very helpful to people who need to make an informed decision or are conducting research. Given the value that Liver Cancer Statistics bring to the table, it’s crucial that all the details on it are accurate. One can easily get overwhelmed when presenting Liver Cancer Statistics because of all the work that has to go into the design process. Aside from research, it’s also important to know how to best present the numbers. That’s where this template from Venngage comes in handy. This template is fully customizable provided you have a free account. If you have yet to sign up for one, click the blue button on the top right corner of the screen and type in your Gmail account, Facebook profile, or email address on the space provided. If you’ve already registered an account before, simply log in to start configuring this template. Venngage pro tip: there are dozens of chart types under the
