Hacker News Infographic Template
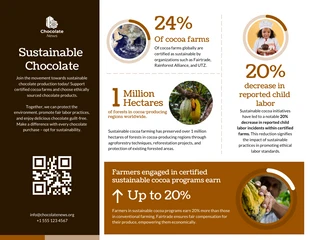
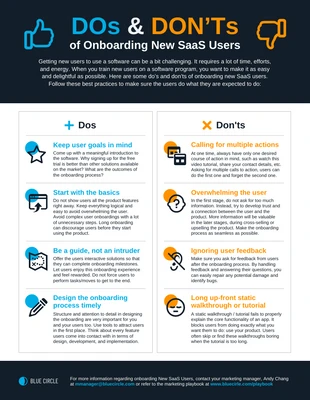
Make a visual stats report by editing this Simple Statistical Infographic Template
100% customizable templates
Millions of photos, icons, charts and graphics
AI-powered editing features
Effortlessly share, download, embed and publish
Easily generate QR codes for your designs
- Design stylemodern
- Colorslight
- SizeCustom (816 x 3851 px)
- File typePNG, PDF, PowerPoint
- Planfree
Develop a bold statistical infographic and more with this Simple Statistical Infographic Template. Make it your own by customizing the charts, icons, and modern color palette. Charts are excellent for helping readers visualize the statistics and other information. There's a wide range of charts available on Venngage and you can personalize them the way you want. Next, incorporate icons to help break up the content and to keep the statistical infographic interesting. There's thousands of icons you can pick from on Venngage, so don't hesitate to choose icons that work for your data infographic. Complete the Simple Statistical Infographic Template by integrating a modern color palette that will make the content more eye-catching. Create your own modern color palette, or select one on Venngage and add it to the statistical infographic. Do you have questions about the Simple Statistical Infographic Template? Click on the chat icon below and one of our team members will be happy to help!
Explore more
- News
