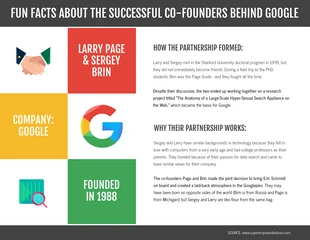
Google IO History Timeline Infographic Template
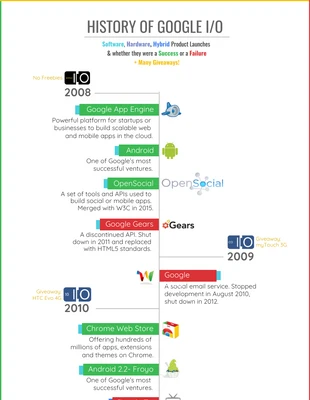
For every in-depth story to tell, get started with the Google's history timeline infographic template!
100% customizable templates
Millions of photos, icons, charts and graphics
AI-powered editing features
Effortlessly share, download, embed and publish
Easily generate QR codes for your designs
- Design stylemodern
- Colorslight
- SizeCustom (816 x 5700 px)
- File typePNG, PDF, PowerPoint
- Planbusiness
Visualize the evolution of any business over the years. The Google history timeline infographic lets you dive deep into any business or industry, using an array of icons, color-codes and images to tell a detailed story. Start by adding your own content. What are you trying to convey? What periods of time are you exploring? First change the years, then your headers, and then your own insights and details. Use unique color palettes to capture different details. Whether something was a physical product, a service, an idea, a success, a failure and more. We have a great icon library to help you visualize each segment, too. Just take a look at the icon library in the side menu. Use the images tab to find any corporate logos you want to use. Once you’re finished your design, you’ll have something comprehensive and professional to share with your audience. Dive in, let us know how it goes. We love to hear back from our cool subscribers.
