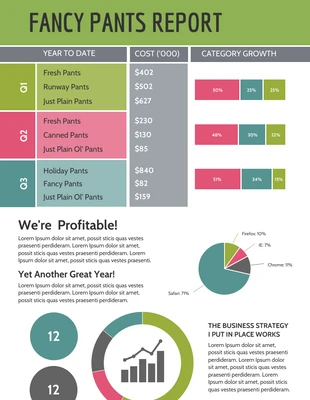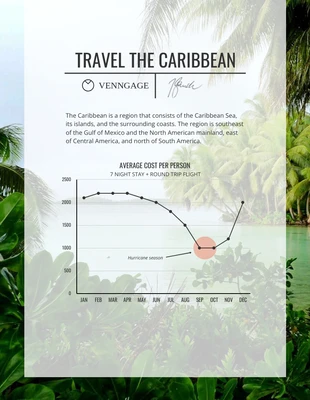
Fancy Pants Report Statistical Infographic Template
Modify this fancy Data Report Infographic Template for a quick and stylish design!
100% customizable templates
Millions of photos, icons, charts and graphics
AI-powered editing features
Effortlessly share, download, embed and publish
Easily generate QR codes for your designs
- Design stylemodern
- Colorslight, vibrant
- SizeCustom (816 x 2000 px)
- File typePNG, PDF, PowerPoint
- Planpremium
Generate a colorful data infographic and more with this editable Data Report Infographic Template. Add charts, pick a dramatic color scheme, and insert photos for an impressive infographic design. Utilize charts to make the data, statistics, and other information more clear to the reader. Charts are easy to understand and Venngage has you covered with a vast collection of charts and tables you can personalize in no time. Next, consider adding a dramatic color scheme that will instantly grab the reader's attention and keep the content interesting to read. You can make your own dramatic color scheme, or you can opt to use one of Venngage's automated color palettes for the Data Report Infographic Template. You can even integrate realistic photos so your data infographic is exciting to look at. Upload photos from your own device, or insert the high-quality stock photos on Venngage to help explain your infographic. Do you have questions about the data infographic template? Contact Venngage through the chat icon below and we'll be happy to assist you!
