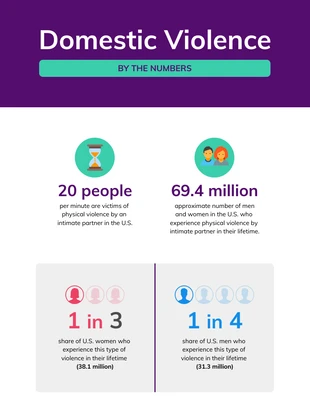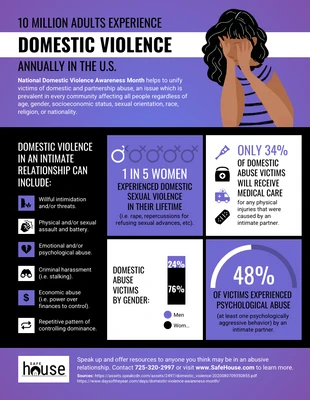
Domestic Violence Statistical Infographic Template
Generate a captivating statistical infographic and more by personalizing this Domestic Violence Statistical Infographic Template
100% customizable templates
Millions of photos, icons, charts and graphics
AI-powered editing features
Effortlessly share, download, embed and publish
Easily generate QR codes for your designs
- Design stylemodern
- Colorslight
- SizeCustom (816 x 2573 px)
- File typePNG, PDF, PowerPoint
- Planfree
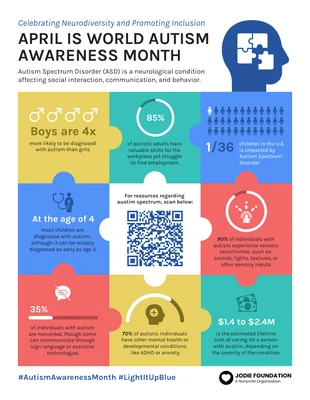
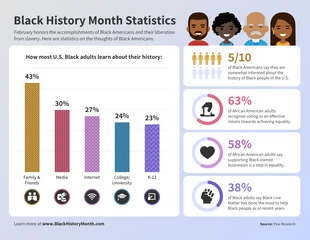
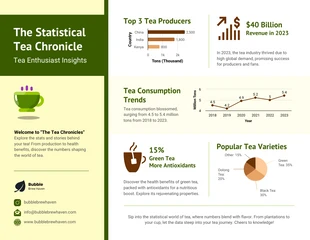
Create a colorful statistical infographic and more with this Domestic Violence Statistical Infographic Template. Incorporate a bright color palette, use icons, and add bold headings so the infographic grabs attention. Bright colors will captivate readers and make the content jump off the page. Pick one of the pre-generated color schemes from Venngage, or make a new bright color palette that fits your infographic. Next, insert icons into the Domestic Violence Statistical Infographic Template to represent each statistic. Look through the Venngage gallery for icons and images that work with your content and add them with a mere click. When it comes to the text, integrate bold headings so that each statistic is easily noticeable. Simply choose the bold typeface option in the editor tool and consider adjusting the point size for more personalization options. Do you have questions about the infographic template? Click on the chat icon below to chat with one of our team members now!
