Impact of Data Visualization Infographic Template
Gauge the impact of data by customizing this Data Visualization Infographic Template
100% customizable templates
Millions of photos, icons, charts and graphics
AI-powered editing features
Effortlessly share, download, embed and publish
Easily generate QR codes for your designs
- Design stylemodern
- Colorsdark
- SizeLetter (8.5 x 11 in)
- File typePNG, PDF, PowerPoint
- Planpremium
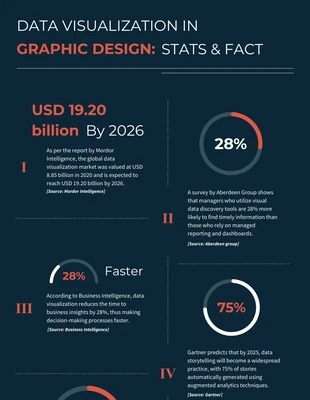
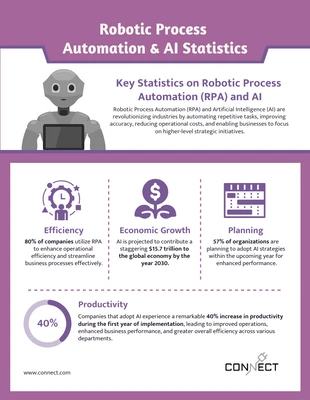
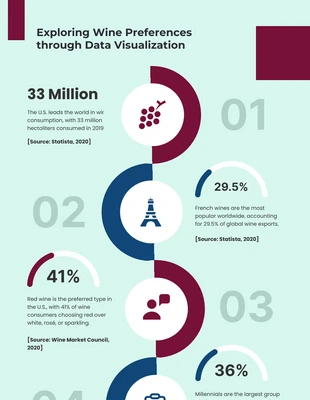
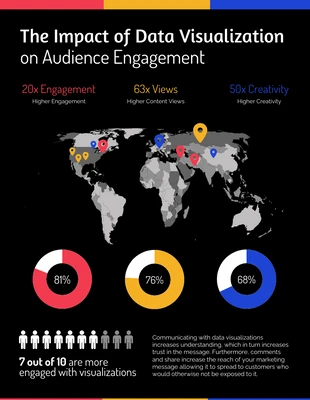
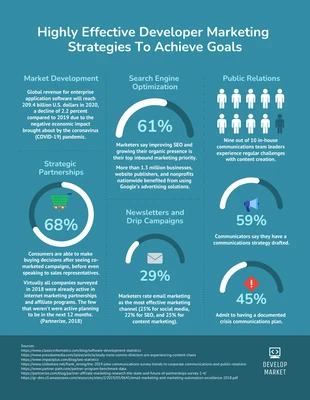
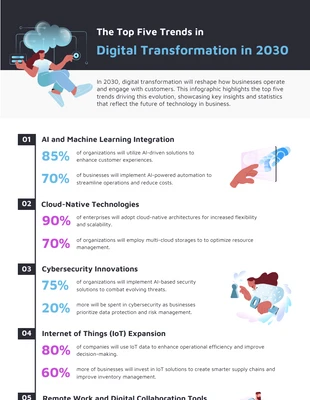
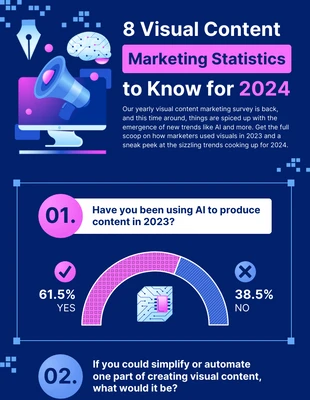
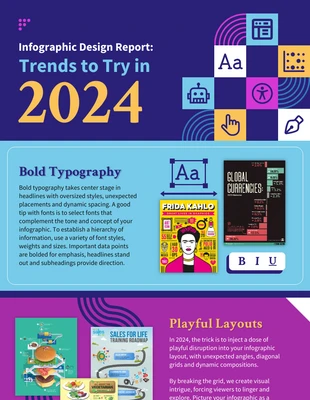
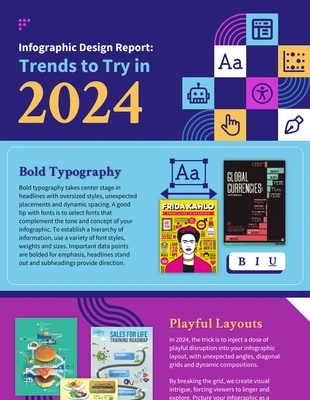
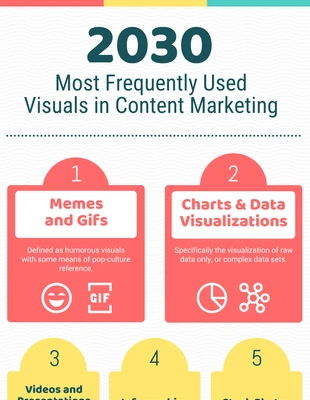
Compose an innovative data infographic and more with this Data Visualization Infographic Template. You can edit the entire infographic, including the bright color palette, charts, and icons. Bright colors are perfect for grabbing people's attention and making the content pop off the infographic. Choose an automated bright color palette on Venngage, or create a new one and apply it to the Data Visualization Infographic Template. Next, insert charts into the data infographic to clearly break down the information. From pie charts to maps, there's a vast collection of charts at your disposal on Venngage and you can upload a file and watch the data transform on the page. Another way you can make the data infographic more your own is by inserting icons to help visualize the data. There's thousands of quality stock icons in the Venngage gallery and you can easily search the types of icons you want and then add them with one click. Get started on your infographic design now!
Explore more
- Communication
- Marketing
- World
