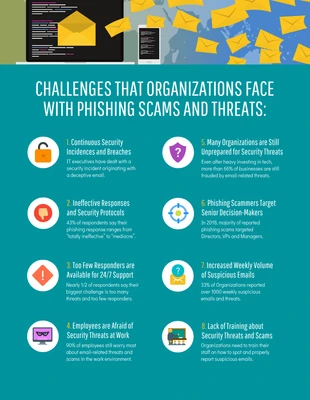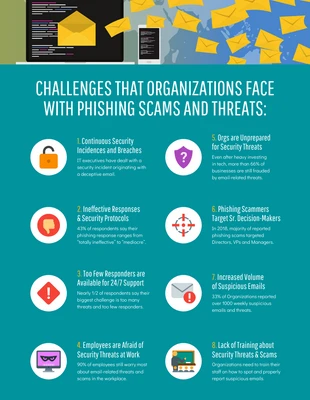
Cyber Security Safety Infographic Template
Create your own Cyber Security Safety Infographic by easily customizing this Cyber Security Safety Infographic template from Venngage!
100% customizable templates
Millions of photos, icons, charts and graphics
AI-powered editing features
Effortlessly share, download, embed and publish
Easily generate QR codes for your designs
- Design stylemodern
- Colorsdark
- SizeCustom (816 x 2250 px)
- File typePNG, PDF, PowerPoint
- Planpremium
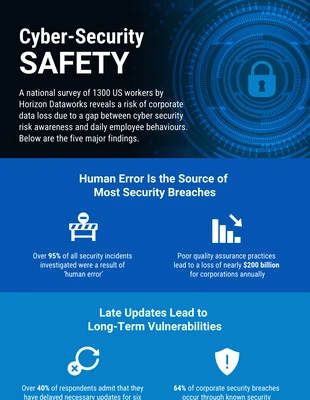
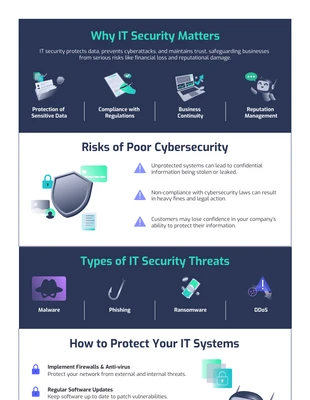
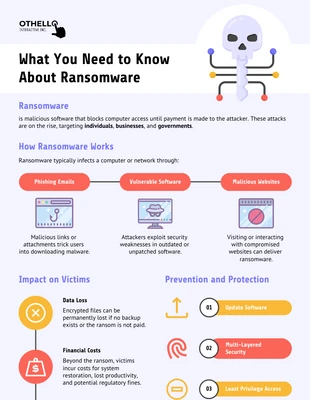
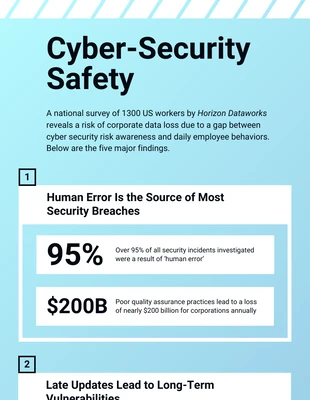
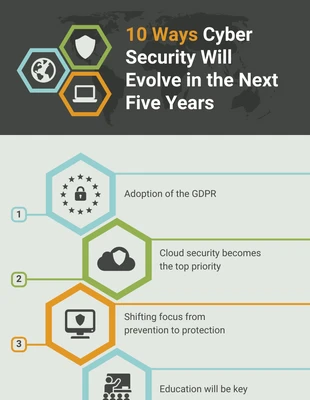
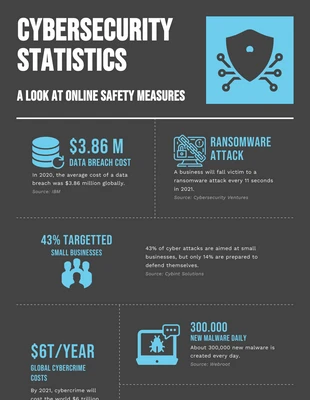
There is an absolute need for cyber security. The key difference, however, is that there are some organizations who have more than enough resources and the latest technology to protect themselves against attacks while others don't even know about the existence of a threat. That's where a statistical infographic comes in to serve as a guide. It educates people about the current cyber security landscape and what needs to be done in order to protect their assets. The statistical infographic is a great way of educating your employees, customers or consumers about new cyber threats, the real risk they pose and how companies are protecting themselves from them. The idea for this type of visual representation is that it conveys information in a compelling, informative and aesthetically appealing manner. Design a professional Cyber Security Safety Infographic using Venngage’s Cyber Security Safety Infographic template. Non-designers can easily create a professional looking graph without any design experience. All they have to do is input the data and choose between a variety of colorful themes and then you can easily customize this Cyber Security Safety
