8 Step Process Infographic Template
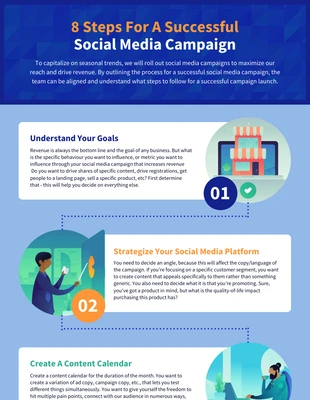
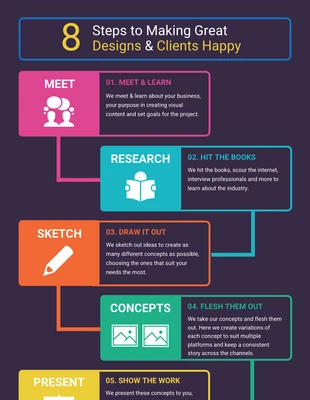
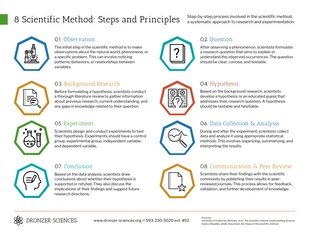
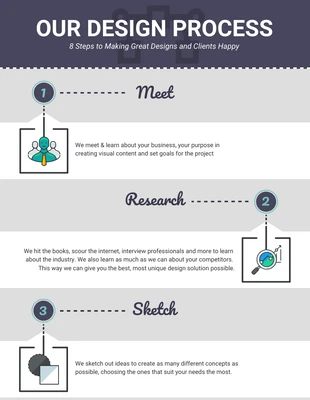
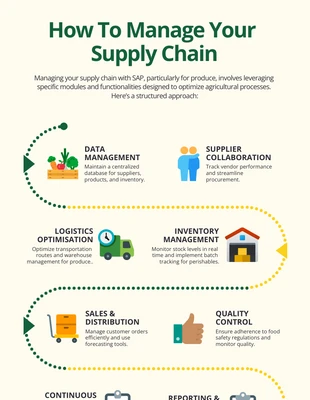
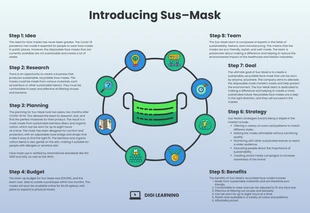
Create a persuasive illustration explaining a complicated process in manageable chunks by personalizing this 8 step infographic template.
100% customizable templates
Millions of photos, icons, charts and graphics
AI-powered editing features
Effortlessly share, download, embed and publish
Easily generate QR codes for your designs
- Design stylemodern
- Colorslight
- SizeCustom (1632 x 1120 px)
- File typePNG, PDF, PowerPoint
- Planfree
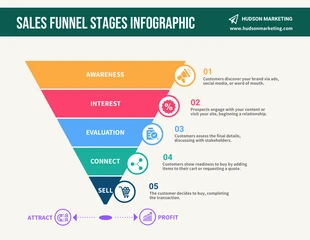
Infographics are graphic representations of information, data, or knowledge designed to display information concisely and clearly. These visual aids make complex data more coherent. They employ charts, graphs, images, and other elements to drive the message. Infographics can effectively communicate educational content, data visualizations, or marketing material. There are numerous types of infographics based on function and style. An 8 step infographic is a type of infographic that breaks down a process or concept into eight steps. This infographic is handy for thoroughly explaining topics and procedures. There are various layouts for this type of infographic, the most common of which is a linear layout, where a different icon or image represents each step. The icons or images are then placed in a sequence from left to right or top to bottom, with arrows connecting them to show the flow of the process or concept. Another style follows a circular layout in which the eight steps are placed around a central image or icon. This layout is beneficial for showing how different concepts or processes are interconnected. In terms of overall style, a typical 8
Explore more
- Process
