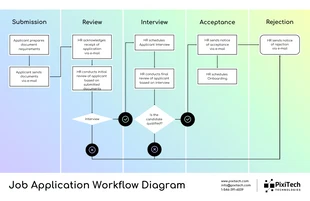
Simple Workflow Diagram Template
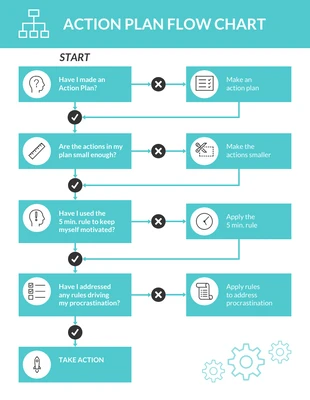
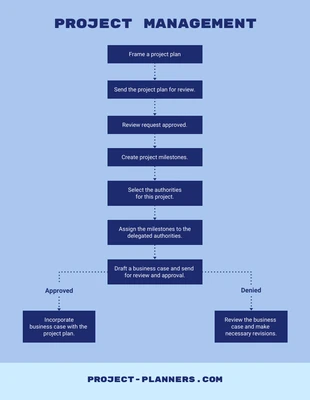
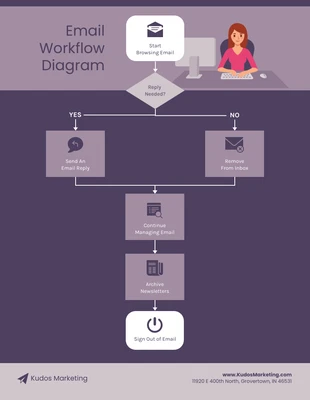
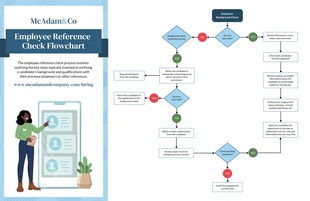
Design a Simple Data Flow Diagram by using Venngage Simple Data Flow Diagram template.
100% customizable templates
Millions of photos, icons, charts and graphics
AI-powered editing features
Effortlessly share, download, embed and publish
Easily generate QR codes for your designs
- Design stylemodern, feminine
- Colorsdark
- SizeLetter (8.5 x 11 in)
- File typePNG, PDF, PowerPoint
- Planbusiness
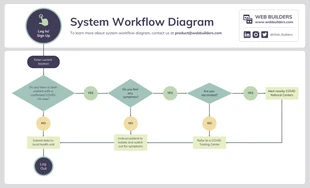
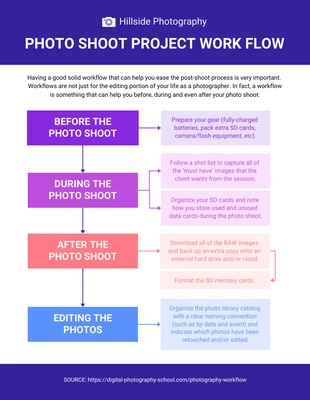
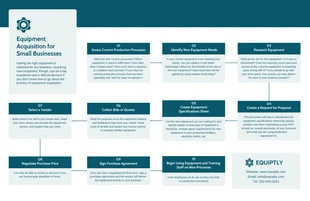
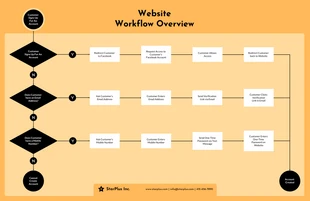
A Simple Data Flow Diagram, or "SDFD," is a tool used to map out how data flows through a system. It's a simple way to visualize the relationships between different components in a system, and how data moves from one component to another. SDFDs are useful for understanding how a system works, and for identifying potential bottlenecks or points of failure. They can also be used to plan out changes to a system, and to track the progress of those changes. Creating this diagram is relatively straightforward. First, you'll need to identify all of the different components in your system, and how they're connected. Then, you'll need to map out the flow of data between those components. You can use arrows to indicate the direction of data flow, and circles or squares to represent components. You don't need to be a designer, or have any design experience, to create a Simple Data Flow Diagram. Venngage's template is designed to be easy to use and customizable. You can add your own text, images, and colors to personalize your diagram, and there's no

