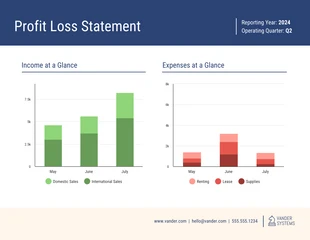
Free Financial Statement Chart Template
Show changes, trends, patterns, and relationships between different pieces of data by customizing this free chart template.
 100% customizable templates
 Millions of photos, icons, charts and graphics
 AI-powered editing features
 Effortlessly share, download, embed and publish
 Easily generate QR codes for your designs
- Design stylemodern, fun
- Colorsvibrant, light
- SizeLetter (8.5 x 11 in)
- File typePNG, PDF, PowerPoint
- Planfree
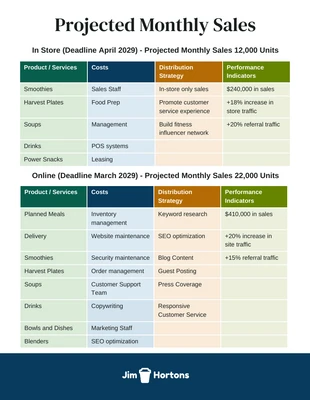
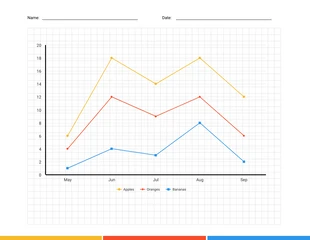
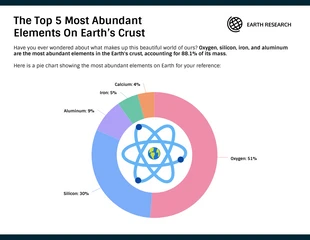
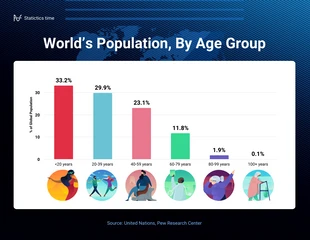
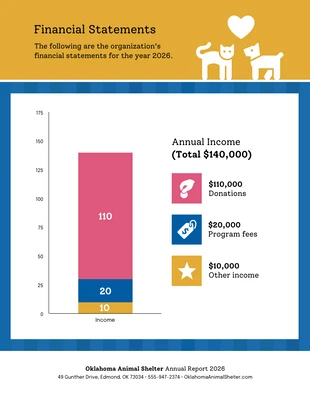
Charts are visual representations of data. You can use it to show trends, patterns, and relationships between different pieces of data. There are many distinct types of charts, and each is best suited for a different purpose. For instance, a line chart is often used to show changes over time, while a bar chart is better for comparing different categories. The essential elements of a chart are the title, data, and labels. The title tells the reader what the chart is about. The data is the information that is represented in the chart. The labels are used to identify the different parts of the data. When creating a chart, choose an appropriate type of chart for the data being represented. For example, a line chart would not be the best choice for categorical data. Once the chart type is selected, the next step is to input the data into the chart. You can do this manually or by using a spreadsheet program. After the data is entered, add the labels to help the reader understand what the data represents. Finally, the chart must have