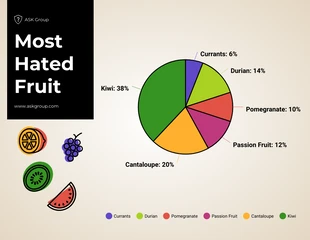
Most Hated Fruit Exploded Pie Chart Template
You can find your exploded pie chart here and you can use the customization tool to personalize it to fit your needs. The template is fully editable!
100% customizable templates
Millions of photos, icons, charts and graphics
AI-powered editing features
Effortlessly share, download, embed and publish
Easily generate QR codes for your designs
- SizeLetter (11 x 8.5 in)
- File typePNG, PDF, PowerPoint
- Planfree
Exploded pie charts are a helpful tool for users to understand the difference between each slice of a pie. They are often used in combination with other forms of data visualization, such as graphs and bar charts, to provide context for the information being displayed. Exploded pie charts make it easy for users to see how one piece of data relates to another piece of data by showing how each piece contributes to the whole. This type of template can help users understand complex data sets by breaking them down into smaller parts that are easier to digest. The size of each section in an exploded pie chart represents the relative importance or significance of that particular piece of information within the bigger picture. Exploded pie charts can be used by anyone who wants to illustrate information in an easy-to-understand way. Most folks don't know squat about design templates. Making a neat and tidy exploded pie chart requires some extra time that may not be warranted. With this in mind, Venngage created a simple-to-use template that can
Explore more
- It

