Table Infographic Template
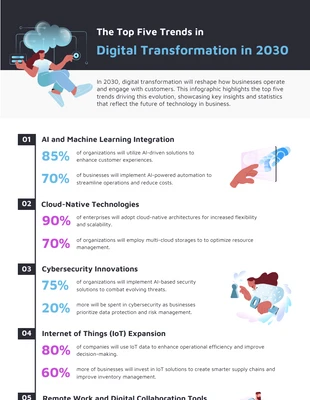
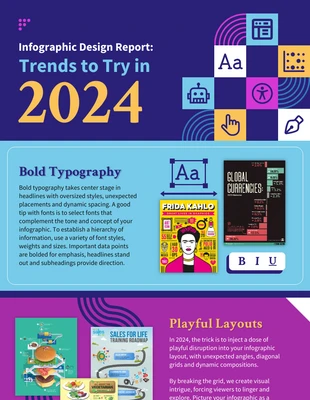
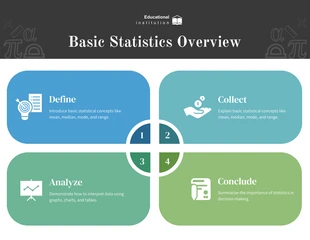
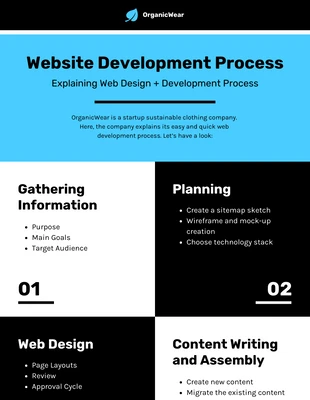
Visualize and create a table infographic by using the Venngage table infographic template.
100% customizable templates
Millions of photos, icons, charts and graphics
AI-powered editing features
Effortlessly share, download, embed and publish
Easily generate QR codes for your designs
- Design stylemodern, fun
- Colorsvibrant
- SizeLetter (8.5 x 11 in)
- File typePNG, PDF, PowerPoint
- Planbusiness
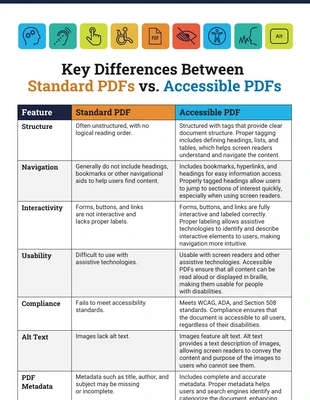
A table infographic is a type of infographic that uses tables to present information. Tables are a common way of presenting data, and they can be used to create an infographic. There are many different ways to create this infographic. You can use a table to present data in a visually appealing way, or you can use a table to create a more complex infographic. Creating a table infographic is a great way to present data in a way that is easy to understand and visually appealing. If you want to create an infographic that is more complex, you can use a table to create a flowchart or other type of graphic. And when you are creating, you will need to decide what information you want to include. You will also need to choose a template that fits your needs. There are many different templates available, so you should be able to find one that meets your requirements. Creating a table infographic is a great way to present data in a visually appealing way. You don’t need design experience or download any
Explore more
- Business
