Project Campaign Statistical Infographic Template
Generate a professional statistical infographic and more by personalizing this Neon Project Campaign Statistical Infographic Template
100% customizable templates
Millions of photos, icons, charts and graphics
AI-powered editing features
Effortlessly share, download, embed and publish
Easily generate QR codes for your designs
- Design stylemodern
- Colorsvibrant
- SizeCustom (816 x 4663 px)
- File typePNG, PDF, PowerPoint
- Planpremium
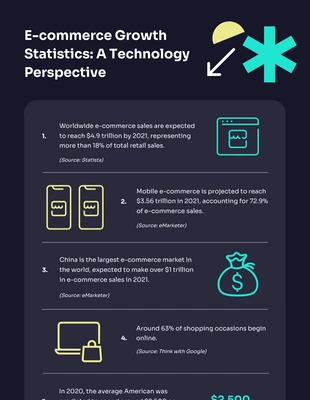
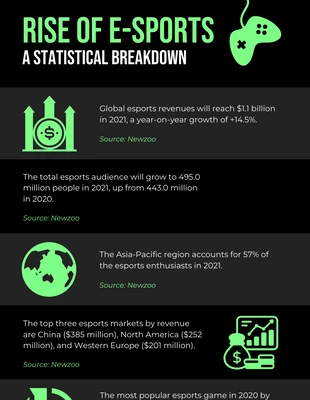
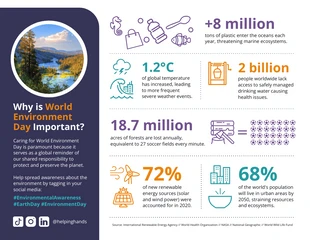
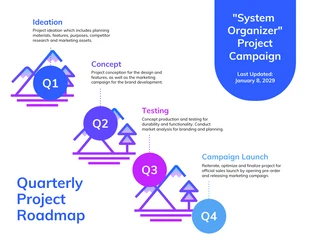
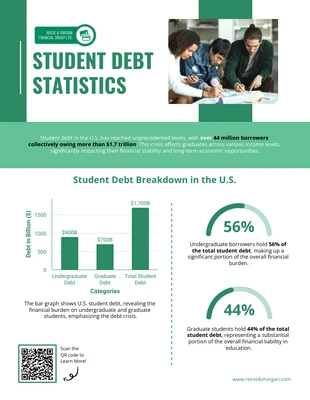
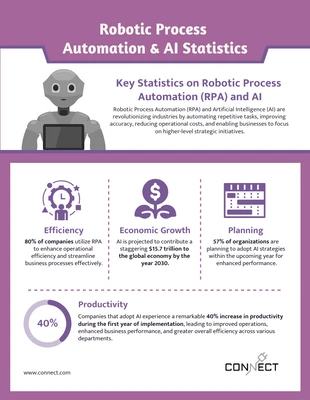
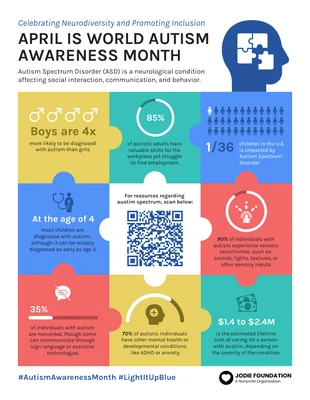
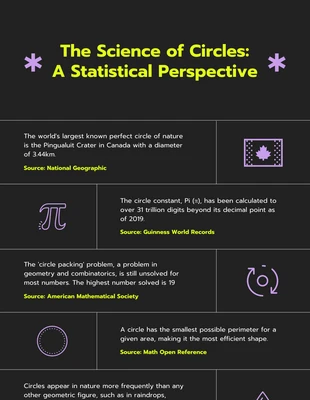
Design a sophisticated statistical infographic and more with this editable Neon Project Campaign Statistical Infographic Template. Make it your own by customizing the infographic with icons, shapes, and a minimal color scheme. Icons are a great way to break up the data and they help communicate the statistics. Venngage has thousands of icons available and you can insert them with a click and watch your infographic transform. This Neon Project Campaign Statistical Infographic Template also uses shapes to emphasize the text. Frame the text and icons with a variety of shapes from the Venngage gallery. For an eye-catching statistical infographic, select a minimal color scheme that enhances the infographic. You can easily create a new color palette with a few colors, or apply an automated minimal color scheme from Venngage to the infographic. Are you looking for other customizable infographics? Browse the Venngage library for more vivid infographic templates that you can personalize within minutes!
