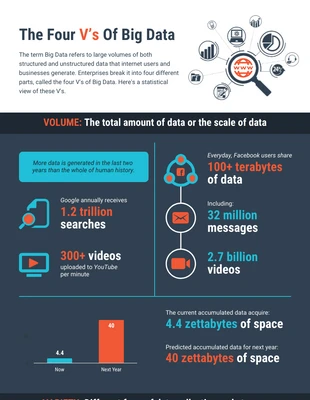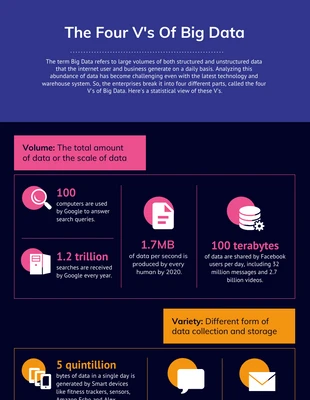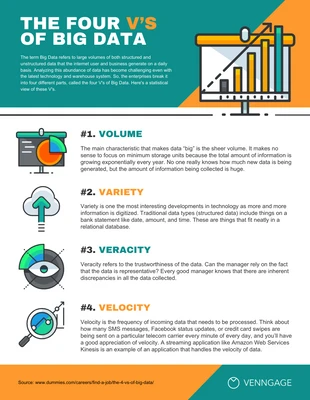
Four V's of Big Data Internet Infographic Template
Modify this Big Data Internet Statistical Infographic Template for a bold data statistical infographic and more
100% customizable templates
Millions of photos, icons, charts and graphics
AI-powered editing features
Effortlessly share, download, embed and publish
Easily generate QR codes for your designs
- Design stylemodern
- Colorslight
- SizeCustom (816 x 2150 px)
- File typePNG, PDF, PowerPoint
- Planfree
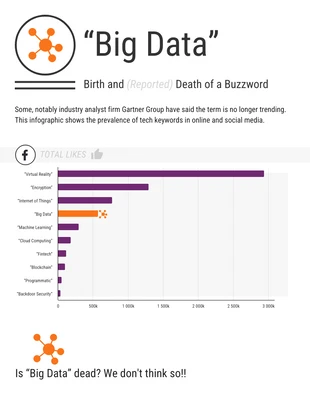
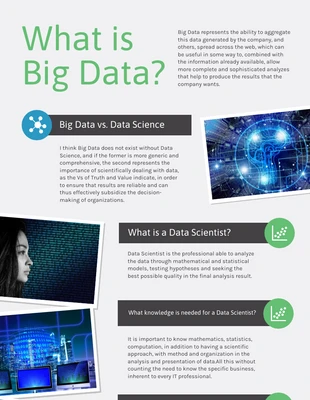
Make a vivid statistical infographic and more with this editable Big Data Internet Statistical Infographic Template. Change the dramatic color palette, insert icons, and add bold text for an eye-catching infographic design. Dramatic colors will make any infographic stand out and are great for keeping people's attention. Choose an automated dramatic color palette in the Venngage editor tool, or create one from scratch with the colors that work for you! Clearly explain the data and break up large amounts of information by utilizing icons. The Venngage gallery has over a thousand icons that you can choose from to make the Big Data Internet Statistical Infographic Template more impressive. As for the data, point out important details and statistics by adding bold text to the infographic. Bold typeface is also great for grabbing attention, so don't hesitate to use them where necessary. Not precisely the statistical infographic you were browsing for? Look through the Venngage library for more creative infographic templates!
