Marketing Flowchart Infographic Template
Follow these steps in constructing a flowchart infographic template for your company’s processes.
100% customizable templates
Millions of photos, icons, charts and graphics
AI-powered editing features
Effortlessly share, download, embed and publish
Easily generate QR codes for your designs
- Design stylemodern
- Colorslight
- SizeCustom (816 x 2010 px)
- File typePNG, PDF, PowerPoint
- Planpremium
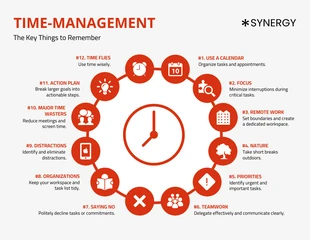
A flowchart infographic is a type of diagram that represents a process or workflow. It usually consists of a series of boxes, diamonds, or other shapes, connected by arrows to show the sequence of steps in the process. Flowcharts can be used to document, map out, or visualize any type of process. In business, a flowchart infographic template is often used to map out processes for manufacturing or other operations. It can also be used to document procedural workflows in office environments. In software development, flowcharts are sometimes used to visualize algorithms or design patterns. Flowchart infographic template can be created with a variety of different software programs, but it is most commonly created with Venngage. Infographic flowcharts are a popular type of flowchart that use images and icons to depict steps in a process. They can be used to make complex processes more visually accessible and easy to understand. Infographic flowcharts are often used in marketing and communications, but they can be used for any purpose where it's helpful to visualize a process. This flowchart infographic template is perfect for explaining a process
