Employee Layoffs Infographic Template
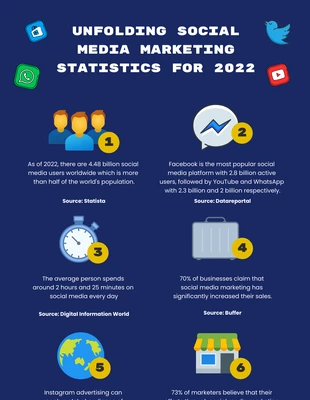
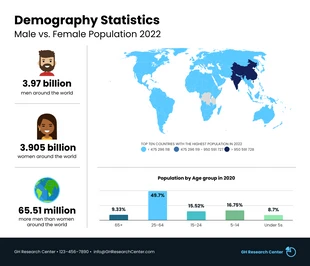
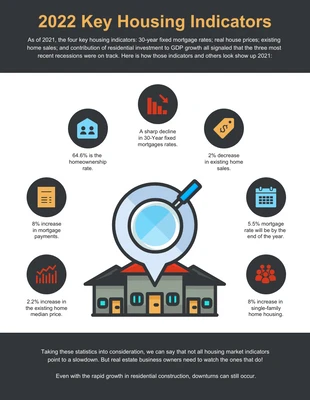
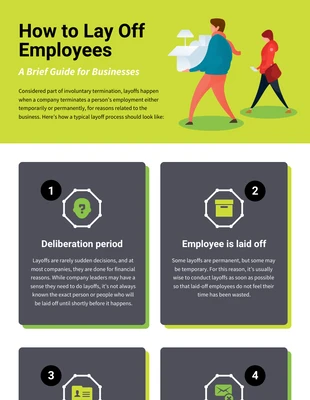
Provide an overview of the scale and scope of layoffs by customizing this user-friendly layoffs 2022 infographic template.
100% customizable templates
Millions of photos, icons, charts and graphics
AI-powered editing features
Effortlessly share, download, embed and publish
Easily generate QR codes for your designs
- Design stylemodern
- Colorsdark
- SizeCustom (816 x 6700 px)
- File typePNG, PDF, PowerPoint
- Planfree
A layoff infographic is a visual representation of data or information related to layoffs. You can use it to provide an overview of the scale and scope of layoffs, as well as to highlight key data points or trends. Businesses, organizations, and individuals can use layoff infographics to communicate information about layoffs concisely and effectively. You can use layoff infographics for various purposes, like educating employees about the company's layoff policy and informing shareholders about the financial impact of layoffs. You can explain the reasons for layoffs to the general public and analyze related data to past layoffs. In making a layoff infographic, do not include personal information about laid-off employees to respect the privacy of those individuals and avoid any potential legal issues. Avoid inflammatory or controversial statements. Layoffs are often a sensitive topic, and it is essential to maintain a respectful and professional tone in all communications related to them. Do not include speculations about future layoffs, as this can cause unnecessary anxiety and fear among employees, making it difficult to plan for the future with certainty. Lastly, remember that a layoff
