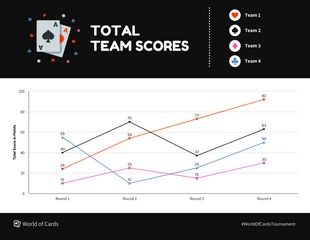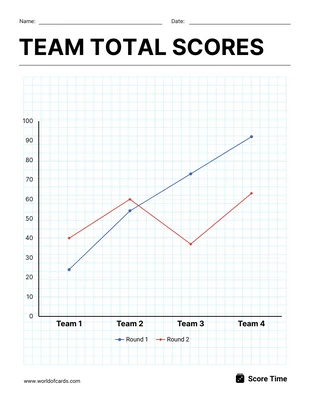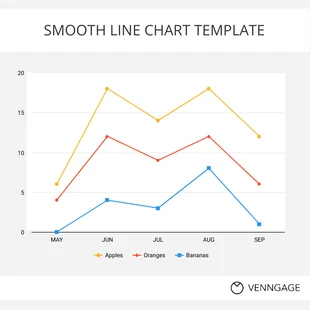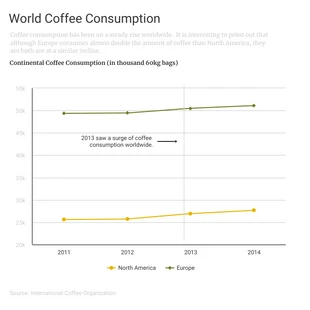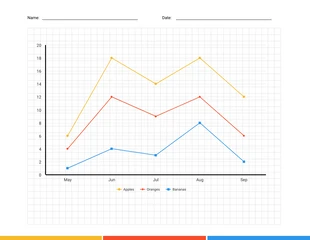
Cards Game Team Scores Line Chart Template
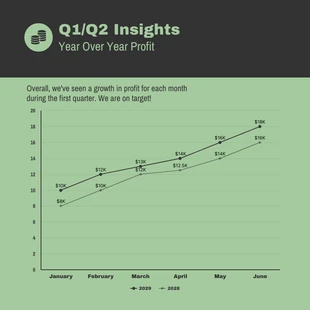
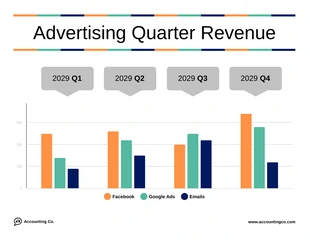
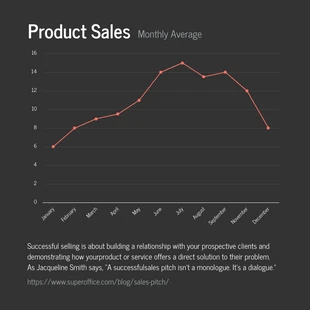
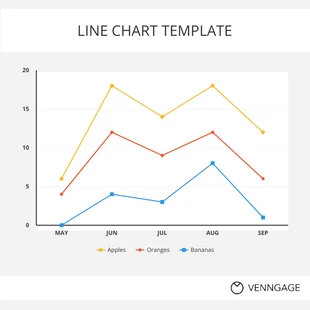
Quickly create a compelling line graph in minutes. Check this example of line graph from Venngage, you can make this as your starting point.
100% customizable templates
Millions of photos, icons, charts and graphics
AI-powered editing features
Effortlessly share, download, embed and publish
Easily generate QR codes for your designs
- SizeLetter (11 x 8.5 in)
- File typePNG, PDF, PowerPoint
- Planpremium
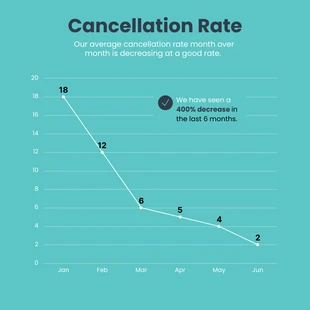
A line graph is a type of graph that shows changes over time. It's often used to display trends in data, or to compare two or more sets of data. Line graphs are useful because they're easy to interpret: it's easy to see which direction the line goes and how it changes over time. They're also useful because they can be used as a way of showing trends, especially when there are several sets of data being compared on the same graph. This example of line graph is beneficial for anyone who wants to understand trends in their data over time; for example: analysts who work with spreadsheets, journalists who write articles about trends taking place within industries like technology or fashion and more. So, if you're looking for a line graph then this template is the best option for you. You need to have a Venngage account in order to access the template editor and design library. You can use your Facebook profile , Gmail account—or email address to create a Venngage account. Once you’ve created your
Explore more
- Graphs
