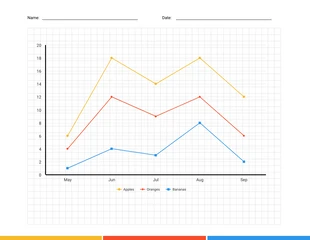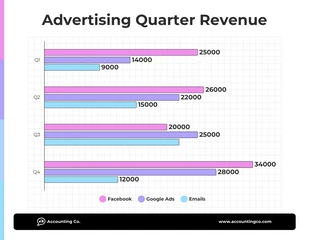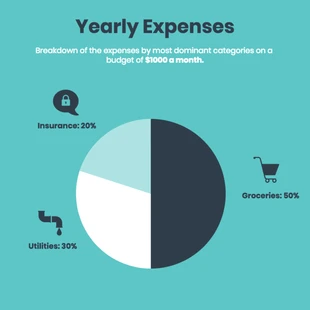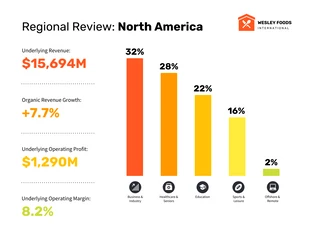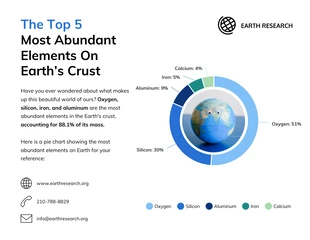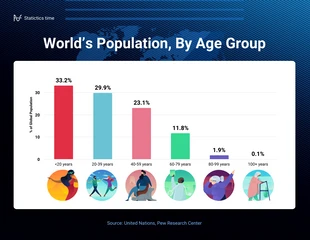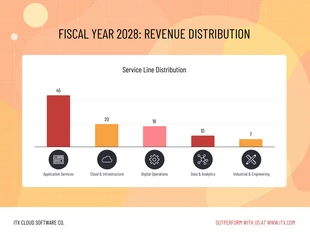
Blank Chart Template
Oversee trends and patterns in data for your business, research, or other purposes by customizing this easy-to-use blank chart template.
100% customizable templates
Millions of photos, icons, charts and graphics
AI-powered editing features
Effortlessly share, download, embed and publish
Easily generate QR codes for your designs
Accessible and WCAG-compliant
- Design stylemodern
- Colorsdark
- SizeLetter (8.5 x 11 in)
- File typePNG, PDF, PowerPoint
- Planfree
A blank chart is a graph or diagram not yet populated with data. It is used as a template onto which data can be entered so that the overall trends and patterns can be seen more clearly. Blank charts are often used in business and research settings, which can help visualize complex data sets and make them easier to understand. Sometimes, you may also use blank charts for decorative purposes. When creating a blank chart, ensure that all necessary elements are included. The most basic blank charts will consist of a title and axes upon which data can be plotted. However, more complex charts may also have labels, grids, or other features that can help to make the data easier to interpret. Also, ensure the graph is large enough to accommodate all of the data entered into it and any labels or other features included. Once a blank chart has been created, you can use it in several ways. You will most likely enter data into the chart to quickly identify trends and patterns. This data can come from various sources, such
